Autores
- Ferrari, Graciela (1)
- (1) Departamento de calidad de agua y evaluación ambiental del laboratorio tecnológico del Uruguay, Latu. Montevideo, Uruguay.
Seasonal variations and interannual changes (2006-2019) of the phytoplankton community, related to variations in water quality and river discharge, in the lower part of the Uruguay River in South America are presented. In total, 422 microalgae and cyanobacterial taxa were identified. Cryptophytes, cyanobacteria, and diatoms were the predominant groups. Although nanoflagellates and cryptophytes were always present in plankton, statistical differences were found in seasonal assemblages of phytoplankton. According to the similarity analysis SIMPER, the typical species for each season were identified: Aulacoseira spp. in winter, Dolichospermum uruguayense, Durinskia baltica and Ankistrodesmus arcuatus in spring, Microcystis aeruginosa, M. wesenbergii, Dolichospermum uruguayense and D. circinale in summer and Ceratium cf. furcoides, A. arcuatus, Raphidiopsis and Jaaginema sp. in autumn. Under lentic river conditions (<2000 m3 s-1) and above 22 ºC, high biomass was recorded due to the blooms of Microcystis and Dolichospermum. In 2010, M. panniformis reached 10.4 µg l-1 microcystin -LR. Raphidiopsis mediterranea and R. raciborskii began to be registered in spring (2009 and 2014 respectively) reaching 1041 cell ml-1 in spring 2017. This paper shows that flow, transparency and temperature are the main factors that regulate phytoplankton biomass and cyanobacterial blooms in the Uruguay River. In the summer, when the Uruguay
KEYWORDS: harmful algal blooms, large rivers, Río de la Plata, diversity.
São apresentadas as variações estacionais e as mudanças interanuais (2006-2019) da comunidade de fitoplâncton, relacionadas com as variações na qualidade da água e a descarga do rio, na parte inferior do Rio Uruguay, na América do Sul. No total, foram identificados 422 táxons de microalgas e cianobactérias. Cryptomonas, cianobactérias e diatoméias foram os grupos predominantes. Embora os nanoflagelados e crytomonas estiveram sempre presentes no plâncton, foram achadas diferenças estatísticas nas assembleias sazonais do fitoplâncton. Segundo a análise de similitude SIMPER, as espécies típicas para cada estação do ano foram identificadas. Para o inverno, Aulacoseira spp.; para a primavera, Dolichospermum uruguayense, Durinskia baltica e Ankistrodesmus arcuatus; para o verão, cianobactérias Microcystis aeruginosa, M. wesenbergii, Dolichospermum uruguayense e D. Circinale; e para o outono, Ceratium cf. furcoides, A. arcuatus, Raphidiopsis sp. e Jaaginema sp. Nas condições lênticas do rio (<2000 3 s-1) e por cima dos 22 ºC, foram registradas altas biomassas devido às florações de Microcystis e Dolichospermum. Em 2010, M. panniformis alcançou os 10,4 µg l-1 de microcistina-LR. Raphidiopsis mediterranea e R. raciborskii começaram a ser registradas na primavera de 2009 e 2014, respectivamente, chegando às 1041 cel ml-1 na primavera de 2017. Os principais fatores que regulam a biomassa de fitoplâncton são o caudal, a transparência e a temperatura. No verão, quando o Rio Uruguai tem caudal baixo, as cianobactérias permanecem no rio. Se o caudal do rio aumenta, as cianobactérias são transportadas água abaixo, podendo chegar até o estuário do Rio da Prata, afetando as praias.
PALAVRAS CHAVE: florações de algas nocivas, grandes rios, Rio da Prata, diversidade.
Introduction
In large rivers, significant autotrophic primary production of phytoplankton is expected and is limited to middle river sections, or to lowland areas of higher-order rivers order presuming favorable conditions for phytoplankton growth (Reynolds and Descy, 1996). In subtropical rivers, the development of phytoplankton biomass is strongly correlated with the concentration of nutrients, turbidity or light availability (Basu and Pick, 1995; Dodds, 2006). According to Reynolds (2000), hydrological factors such as discharge and dead zones (areas of high resilience) are the most important factors in the development of the rivers’ phytoplankton. In the subtropical region, seasonal changes in the phytoplankton community are related to seasonal changes in temperature (Cloern, et al., 2014).
The Uruguay River is one of the largest rivers in South America (>1,800 km); it belongs to the La Plata Basin, forming the triple border of Brazil, Argentina and Uruguay. One of the main factors affecting the river’s water quality was the construction of more than ten hydroelectric dams (i.e. Itá, Machadinho, Itapiranga, Roncador, Garabí, San Pedro, Salto Grande) to meet the growing energy demands which accompanied the region’s economic growth, (National Water Agency, ANA, 2005). In Uruguay, the Salto Grande Dam, located 300 km upstream from the mouth of the river, has an important regulatory effect over the discharges above and within the Río de la Plata estuary (EcoMetrix, 2006). Based on historical values (1980-2015), the average annual discharge of the river is 5527 m3 s-1, but in 2017, it reached 7598 m3 s-1 (Salto Grande Mixed Technical Commission, [s.d.]).
Agriculture is an important activity in the Lower Uruguay River Basin with a significant production of citrus fruit and other crops (O’Farrell and Izaguirre, 2014). The most important Uruguayan city in the area studied is Fray Bentos, which is also an active port. This lower section of the Uruguay river gained importance after the installation of a pulp mill in 2006, and the subsequent start of its operations in November 2007 (Uruguayan Technological Laboratory, LATU, 2019). Periodical reports on navigation, cyanobacterial blooms and fisheries surveys are published locally by the Salto Grande Mixed Technical Commission and the Uruguay River Administrative Commission (CARU, [s.d.]). In addition to this, binational monitoring in the pulp mill’s area of influence has been carried out since 2012 and along the binational Argentina-Uruguay section since 2018. CARU surveys the state of the river through water, sediment and biota samples monitoring on both sides of the river and in the center of the channel showing the acceptable limits. Thirteen water quality parameters measured showed concentration values above the limits established in CARU’s Standard for 179 variables. Parameters that systematically exceed CARU Digest levels are Iron, Oils and Fats, and Total Phenolic Substances (CARU, [s.d.]).
Although several authors have conducted phytoplankton studies in the Uruguay river basin (de Díaz, 1961; et al, 1986; O’Farrell, 1994; O’Farrell and Izaguirre, 1994; Bonilla, 1997; Pérez, et al., 1999; Pérez, 2002), most of the existing studies on the Uruguay River were focused on the Salto Grande dam (Quirós and Luchini, 1982; De León and Chalar, 2003; Chalar, 2006, 2009; O’Farrell, et al., 2012; Chalar, et al., 2002, 2017;) since 1979, when the lake reservoir was formed. Little research has been done on the topic of phytoplankton composition and ecology in its lower part. O’Farrell and Izaguirre, (1994), showed a gradient along the Argentinean banks and the Uruguay River’s tributaries during 1986-1987 where the potamoplankton was dominated by nanoflagellates, cryptophytes and Aulacoseira genus. They found that the seasonal succession of phytoplankton diversity was mainly regulated by temperature, transparency and water discharge, with turbidity showing up as a limiting factor for algae development during summer’s low water periods, but a correspondence analysis was not performed. Many other reports focused on cyanobacterial blooms. Ferrari and others (2011) reports two possible scenarios which could account for the dynamics of cyanobacterial blooms in the Lower Uruguay River. The first one is that in high flow conditions, the bloom is concentrated in the dam and reaches the open waters of the Río de la Plata estuary as a result of rainfall, or because of the management of the Salto Grande dam. During the summer, when low flow conditions (lentic conditions) are present, the bloom is concentrated locally by a stable high water column. A marked gradient was observed in the meteorological, physical, and chemical parameters of the plankton assemblages from Salto Grande to Punta del Este, in a comprehensive monitoring during 2013-2014, along the Uruguay River’s banks and the Rio de la Plata coastline (Kruk, et al., 2015). In the sampling from both summers (2013 and 2014), a Microcystis bloom was registered in the Salto Grande dam. An exceptional bloom observed in the summer of 2019 reached Uruguay’s Atlantic ocean coast. This event occurred under extreme precipitation conditions that induced high water flows, which transported cyanobacterial blooms downstream (Kruk, et al., 2019). Recently, a synoptic study showed the relevance of temperature and precipitation on the distribution of cyanobacteria, comparing lentic and lotic freshwaters in the country (Haakonsson, et al., 2017). The study found that the filamentous Dolichospermum was the most widely distributed and the most frequent genus in the region surveyed.
The aim of this study was to identify the main factors that produce seasonal changes in the phytoplankton community of the lower Uruguay River, as well as its relationship with water quality. This work is based on the data compiled over a fourteen-year period (2006 to 2019). We reported on the composition, abundance, carbon biomass of microalgae and cyanobacteria and water quality variables.
Material and methods
Study area
Uruguay belongs to a subtropical climate zone (Kottek, et al., 2006) characterized by hot and humid summers and generally mild winters with the following features: mild moderate rain (1000-1600mm annual average between 1961-1991), humid subtropical climate (Cfa type) (INUMET, [s.d.]) and annual average temperature of 17.5 ºC with temperatures above 22 ºC in the warmest months. During the study period (2006-2019) the average values of air temperature were 17.9 ºC with precipitation values of 1207 mm, (data provided by UPM weather station).
The study area comprises three sites along the lower part of the Uruguay River: an upstream site located in Nuevo Berlín (NB), a central site in Fray Bentos (FB) and a downstream site at Las Cañas (LC). A long-term (2006-2019) seasonal sampling was carried out at the three sites. In each site, three samples were taken covering littoral, center and channel zones of the Uruguayan section of the river (Figure 1). The NB site is located between natural channels and islands. The central site, FB, is located close to the international bridge and the city of Fray Bentos, which is also an active port. In the downstream site at LC, the river becomes wider, forming an extensive plain with sandy beaches that attract a significant number of tourists during summertime.
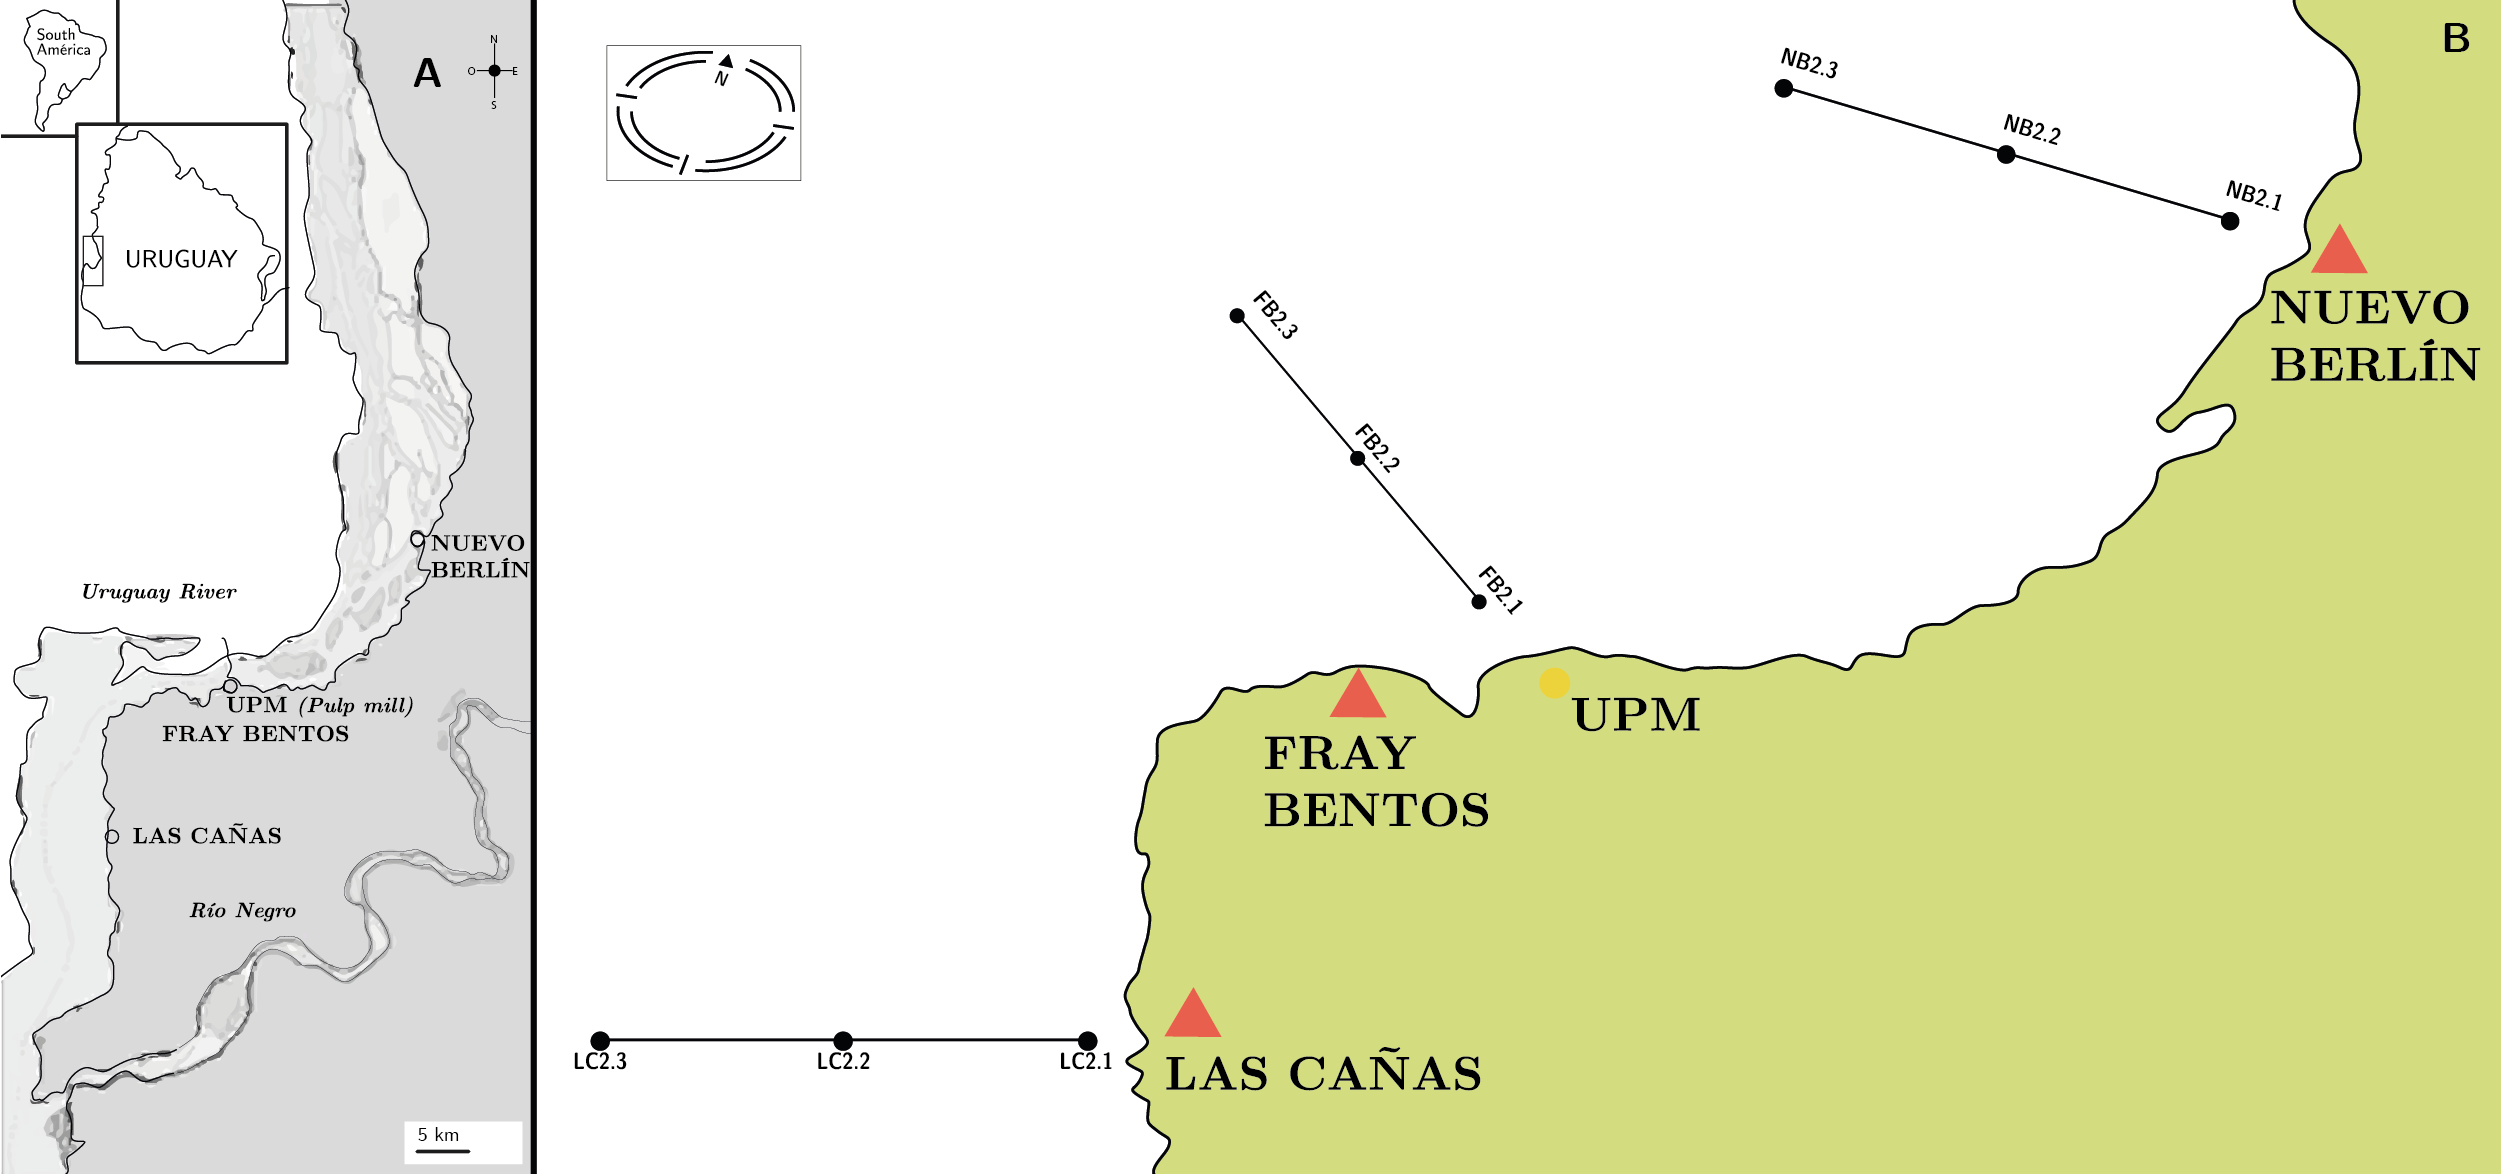
Figura 1. A) Study area of the Uruguay River and sampling sites from upstream to downstream: Nuevo Berlín (NB), Fray Bentos (FB) and Las Cañas (LC) (black-white circles). B) Sampling design.
Samplings and analysis
Fourteen seasonal sampling surveys (summer: February, autumn: May, winter: August and spring: November) on three sites with a transect with three points (littoral, center and channel) were carried out during July 2006 to November 2019, with a total of 486 sampled points (Figure 1). Conductivity, temperature, oxygen and pH were measured in situ with a YSI 6600 V2 sensor and the transparency was estimated with a Secchi disc. Water samples were taken directly for nutrients and chlorophyll analyses, using standard methods as described in detail by Ferrari and others (2011), Tana and others (2013), Uruguayan Technological Laboratory, LATU (2016, 2017, 2018, 2019). Discharge at the Salto Grande dam displays considerable variability related to regional and global processes, with high discharges during El Niño events in phase with El Niño Southern Oscillation (ENSO) due to heavy rainfall (Colombo, et al., 2015). The opening and closing of the floodgates is the main influence on the flow of the river, since in this lower section there is no significant contribution from tributaries that could modify its flow rate. The daily average of the Salto Grande dam discharge was obtained for the period of study from the river’s binational monitoring entity (Salto Grande Mixed Technical Commission, [s.d.]). The total nitrogen and total phosphorus were used tu calculate N:P atomic ratios. The monthly geometric mean total phosphorus concentration following IET (PT) = 10*(6-((0,42 – 0,36*(ln PT))/ln 2)) – 20 was used to determine the Uruguay River’s trophic status (Lamparelli, 2004). Subsurface phytoplankton samples were collected with bottles and fixed in situ with Lugol’s solution for quantification, and net samples were collected and fixed with formaldehyde (4%) for taxonomical studies (Sournia, 1978). When cyanobacterial blooms occurred, cyanobacteria samples were gathered for microcystin-LR analysis were taken using HPLC, according to the ISO 20179 (International Organization for Standarization, 2005). During the sampling period, three extra samplings were carried out in the summer of 2009 and the spring of 2010, as a result of a cyanobacterial bloom warning in the area near the Fray Bentos site.
The sedimentation method based on Utermöhl (1958), was used to identify and quantify phytoplankton. Half or the entire chamber was screened under low magnification (100 or 200x) for organisms >50 µm, while smaller organisms were counted under 400x magnification according to cell density in each sample. Phytoplankton organisms were identified at the lowest possible taxonomic level and divided into groups or Classes. For cyanobacteria, the most recent taxonomical classification presented by Komárek and others (2014) was used. Determinations were made following Komárek and Anagnostidis (2008a, 2008b) and Komárek (2013). To identify some diatoms, the oxidation technique was followed (Battarbee, 1986). Counts included at least 100 cells of the most abundant species, in order to achieve a confidence interval of 95% (Lund, et al., 1958). In the case of Microcystis spp. blooms, the methodology followed Box (1981), counting the number of cells per ml in a gridded Sedgewick-Rafter counting chamber. Biovolume was estimated from mean cell dimensions and shape based on Hillebrand and others (1999). The cell biovolume was transformed to biomass as cell carbon (pgC cel-1), according to Menden-Deuer and Lessard (2000). Biovolume was multiplied by the density (cell ml-1) to estimate phytoplankton carbon biomass (ngC ml-1). Picoplankton cells (<2 µm) were not counted because this requires a special methodology.
Exploratory analyses were performed to identify major patterns and define final tests. In order to evaluate spatial (site and zone) differences among samplings, analyses of similarities ANOSIM were performed with phytoplankton and environmental matrixes. The carbon biomass of the main phytoplankton groups (Cyanobacteria, Chlorophyta, Bacillariophyta, Cryptophyta and “other”) were logarithmically transformed and similarity matrices were constructed with the Bray-Curtis index. ANOSIM results showed significant temporal differences between sampling surveys regarding biomass matrix (RGlobal = 0.544), meanwhile no significant spatial differences were found in either sites (RGlobal = 0.011, p>0.001) or in zones, (RGlobal = 0.016, p>0.001). The same results were found with environmental matrices, (RGlobal temporal = 0.876, p> 0.001) with no differences either per sites (RGlobal sites = -0.016, p>0.001) or per zones (RGlobal zones = 0.017, p=0.001). In addition, the analysis of variance ANOVA showed no significant differences either between the three sites (NB, FB and LC) or between zones (littoral, center and channel) for phytoplankton density F (4, 477) = 0.79, p = 0.52, biomassF (4, 477) = 0.92, p = 0.45, richness FF (4, 477) = 0.16, p = 0.95 and Shannon diversity index F (4, 477) = 1.21, p = 0.30. Those analyses enable the use of monthly averages. For those analyses, environmental variables were used: (nitrates (NO3 mgl-1), total nitrogen (TN mgl-1 ), nitrate (NO3 mgl-1), total phosphorus (TP µgl-1), soluble reactive phosphorus (PO4 µgl-1), chlorophyll a (Chl a µgl-1), Secchi disk (SD cm), conductivity (mS cm-1K), temperature (T ºC), pH and discharge (Qm3s-1), were normalized and Euclidean indexes were used for the similarity matrix. Flow data of the sampling dates were used to perform the analysis.
To evaluate the role of each species and its contribution to the season, the coefficients of similarity between samples and the average similarity / dissimilarity between all the pairs of samples in each group was calculated, applying the similarity percentages breakdown (SIMPER) using the PRIMER routine (Clarke and Warwick, 2001). This analysis identifies the species that are mostly responsible for the observed patterns. Species that contributed the most to the similarity within a season were considered typifying. The species that contributed the most to the dissimilarity within a group, were considered discriminates between groups (Clarke, 1993, Clarke and Gorley, 2006). For the SIMPER analysis, the biomass matrix was used. The small Cryptophytes heterotrophic organisms were not considered for this analysis. A one way ANOSIM was performed to analyze differences between seasons.
For the environmental matrix, Spearman’s correlation coefficient was used. Bubble biplots were used to highlight the relationship between flow and temperature in phytoplankton biomass. For XY graph, Crytophytes were not considered. To determine the set of environmental variables which contribute to explain the variability of phytoplankton biomass, we performed a Canonical Correspondence Analysis (CCA) using the unimodal method. This analysis is valid to apply for any size of the environmental gradient (Legendre and Legendre, 2012). A biomass matrix for species with >25% in the total Log10 (x +1) sample was used. The environmental matrix was normalized and the significance of the contributions from environmental variables with the ordination of species was tested through Monte Carlo permutations test (p <0.05). The significance of canonical correlation coefficients of each environmental variable for axes 1 and 2 was evaluated by means of an approximation of t-Student statistic (Ter Braak, 1986). A Multivariate Stadistical Package (MVSP software) was used.
Results
Environmental variables
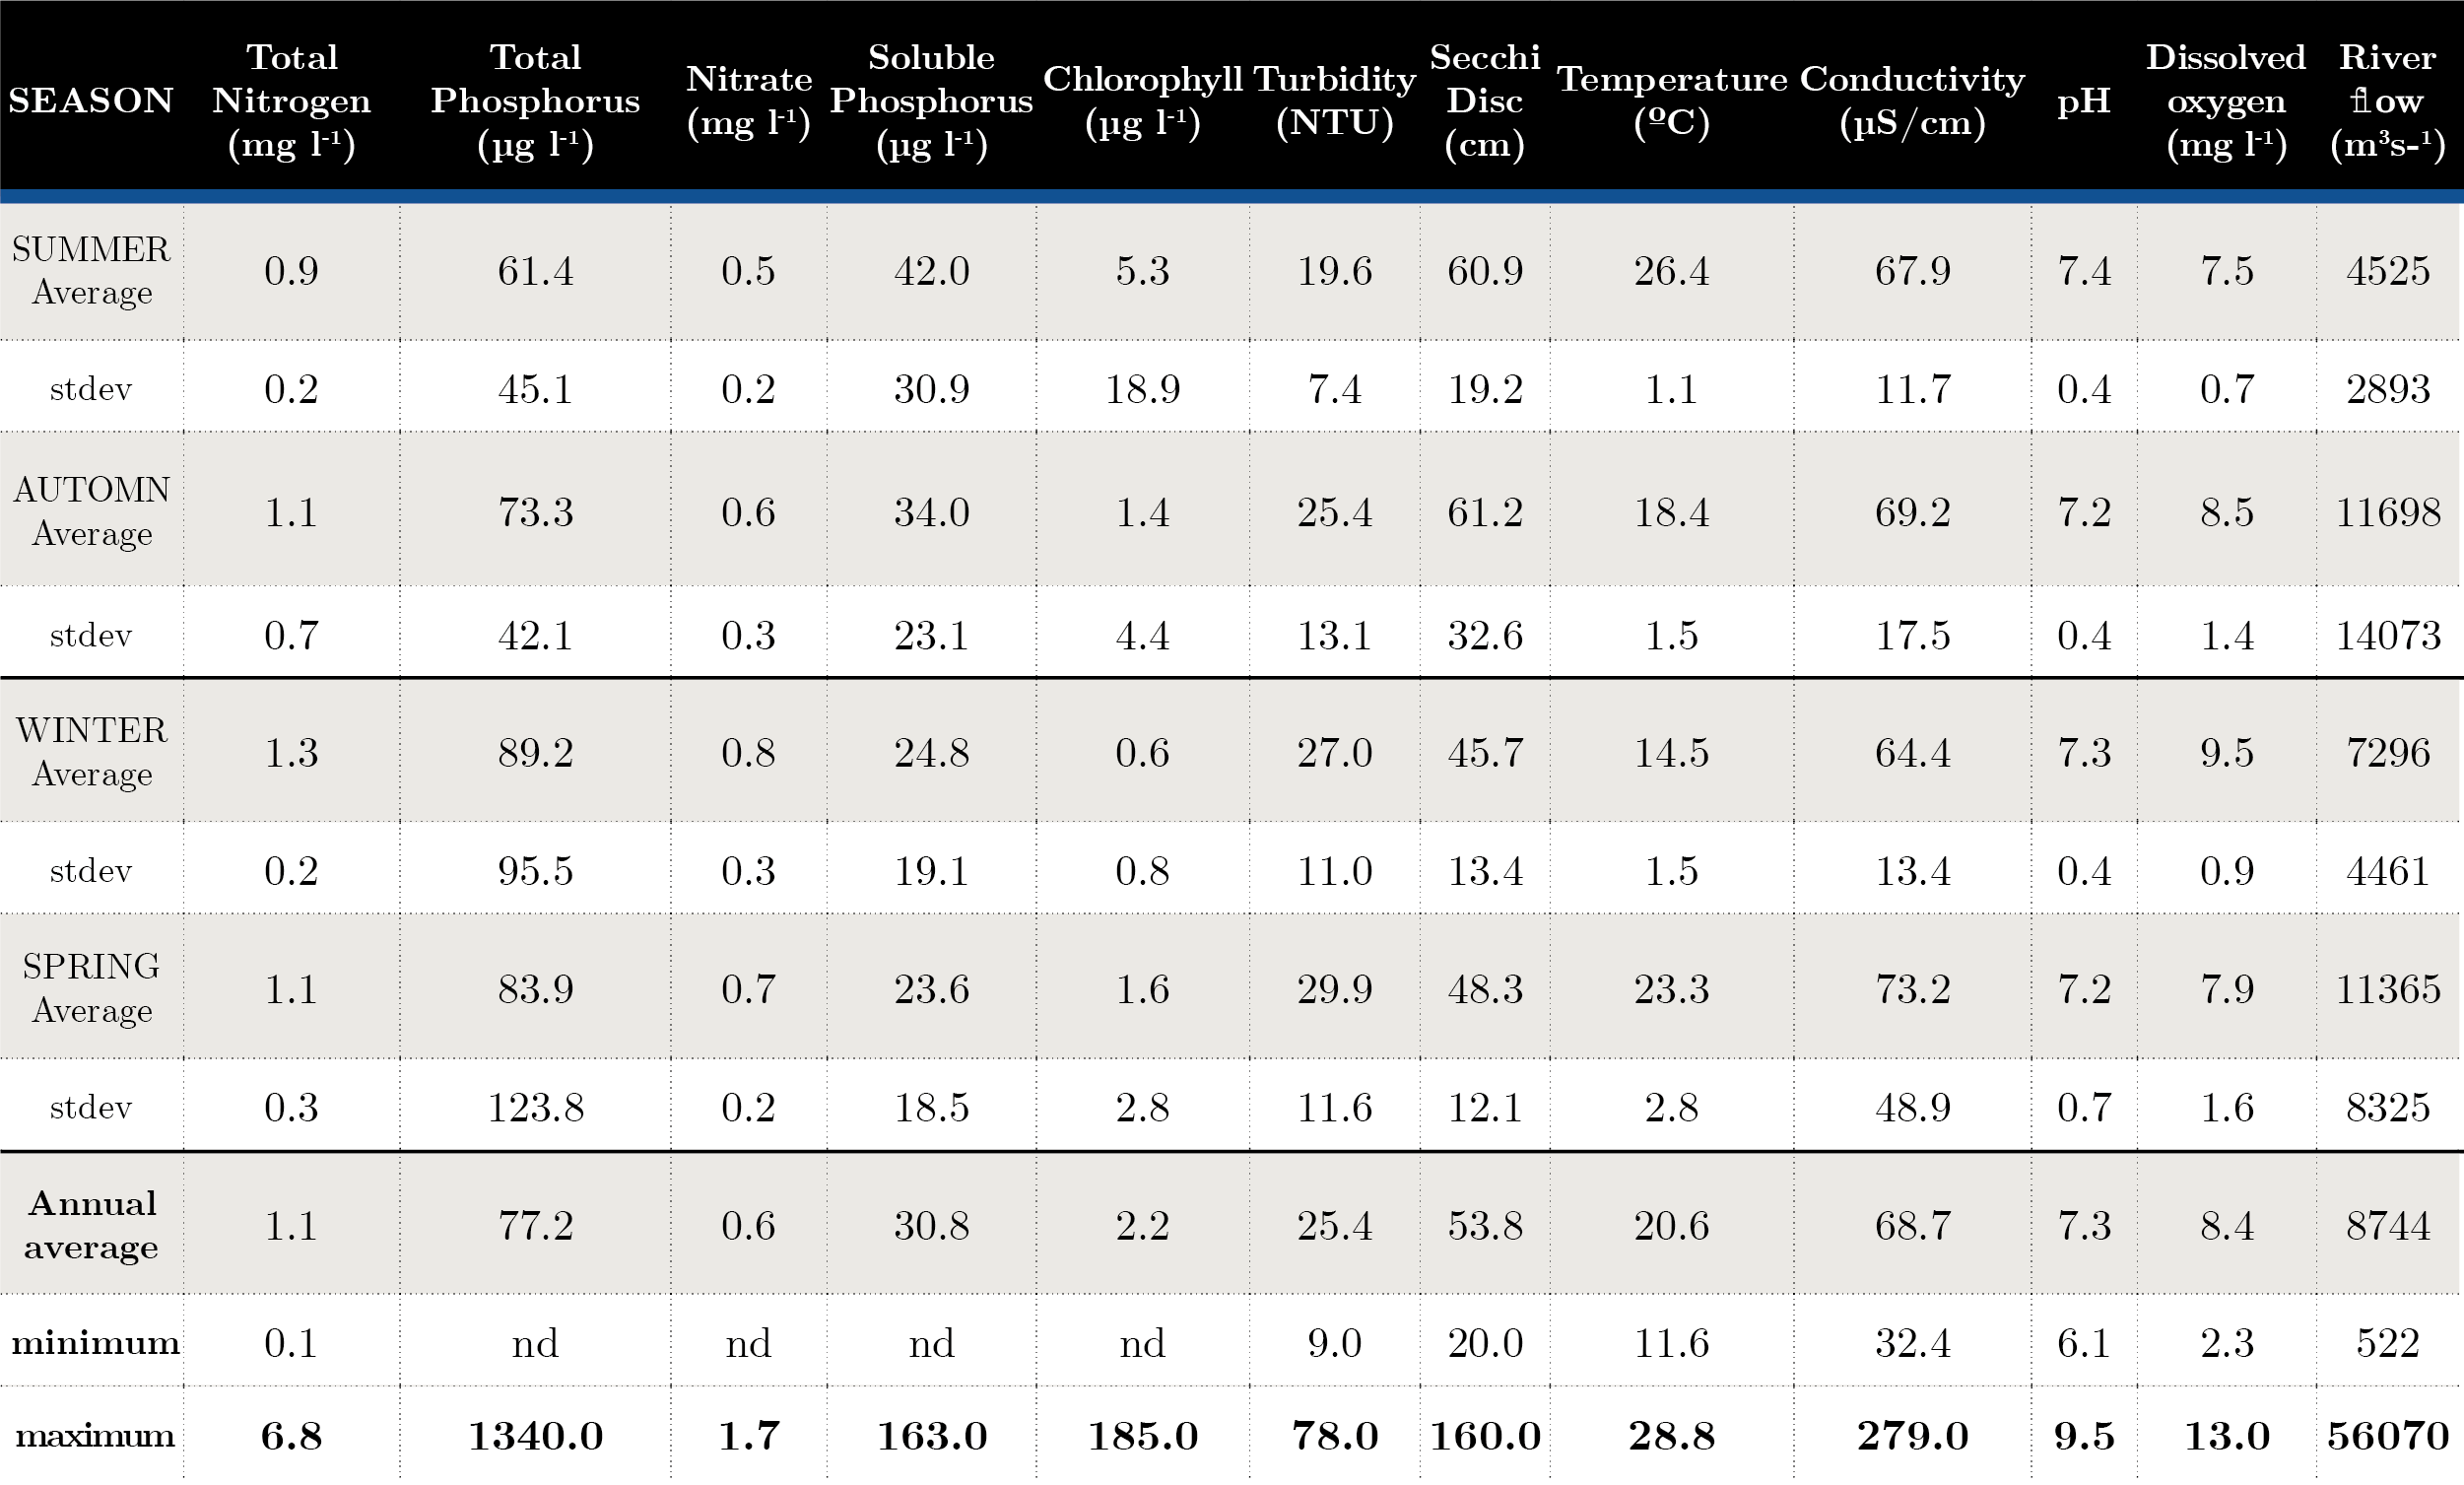
Surface water temperature varied seasonally between 11.5 ºC in winter and 28.8 ºC in summer. Conductivity showed low variation (32-279 µS cm-1) throughout the period. pH did not show a wide range of variation (6.1-9.5); the Secchi disc values ranged between 0.20 and 1.60 m and the turbidity reached 78 NTU (Table 1).
Tabla 1. Seasonal average and maximum-minimum during 2006-2019. Average and standard deviation of nutrients and in situ parameters for each season. nd: Not determined.
Nutrient fluctuation at the three sites was similar, with an increase in total nitrogen at NB (in winter), while soluble phosphorus showed three peaks in autumn 2007, 2011 (near 100 µg l-1). Fluctuations of total phosphorus remained within historical ranges, with the exception of two peaks, one in August 2011 at the three sites, with the highest concentration at FB reaching values of 887 µg l-1, and in November 2019 with 1340 µg l-1 at FB (Table 1). The general trophic state of the Uruguay River was mesotrophic (52-59), presenting some eutrophic (60-63) sampling in Aug-11, Feb-17, May-19, Nov-19 due to peak of total phosphorus (Figure 2).
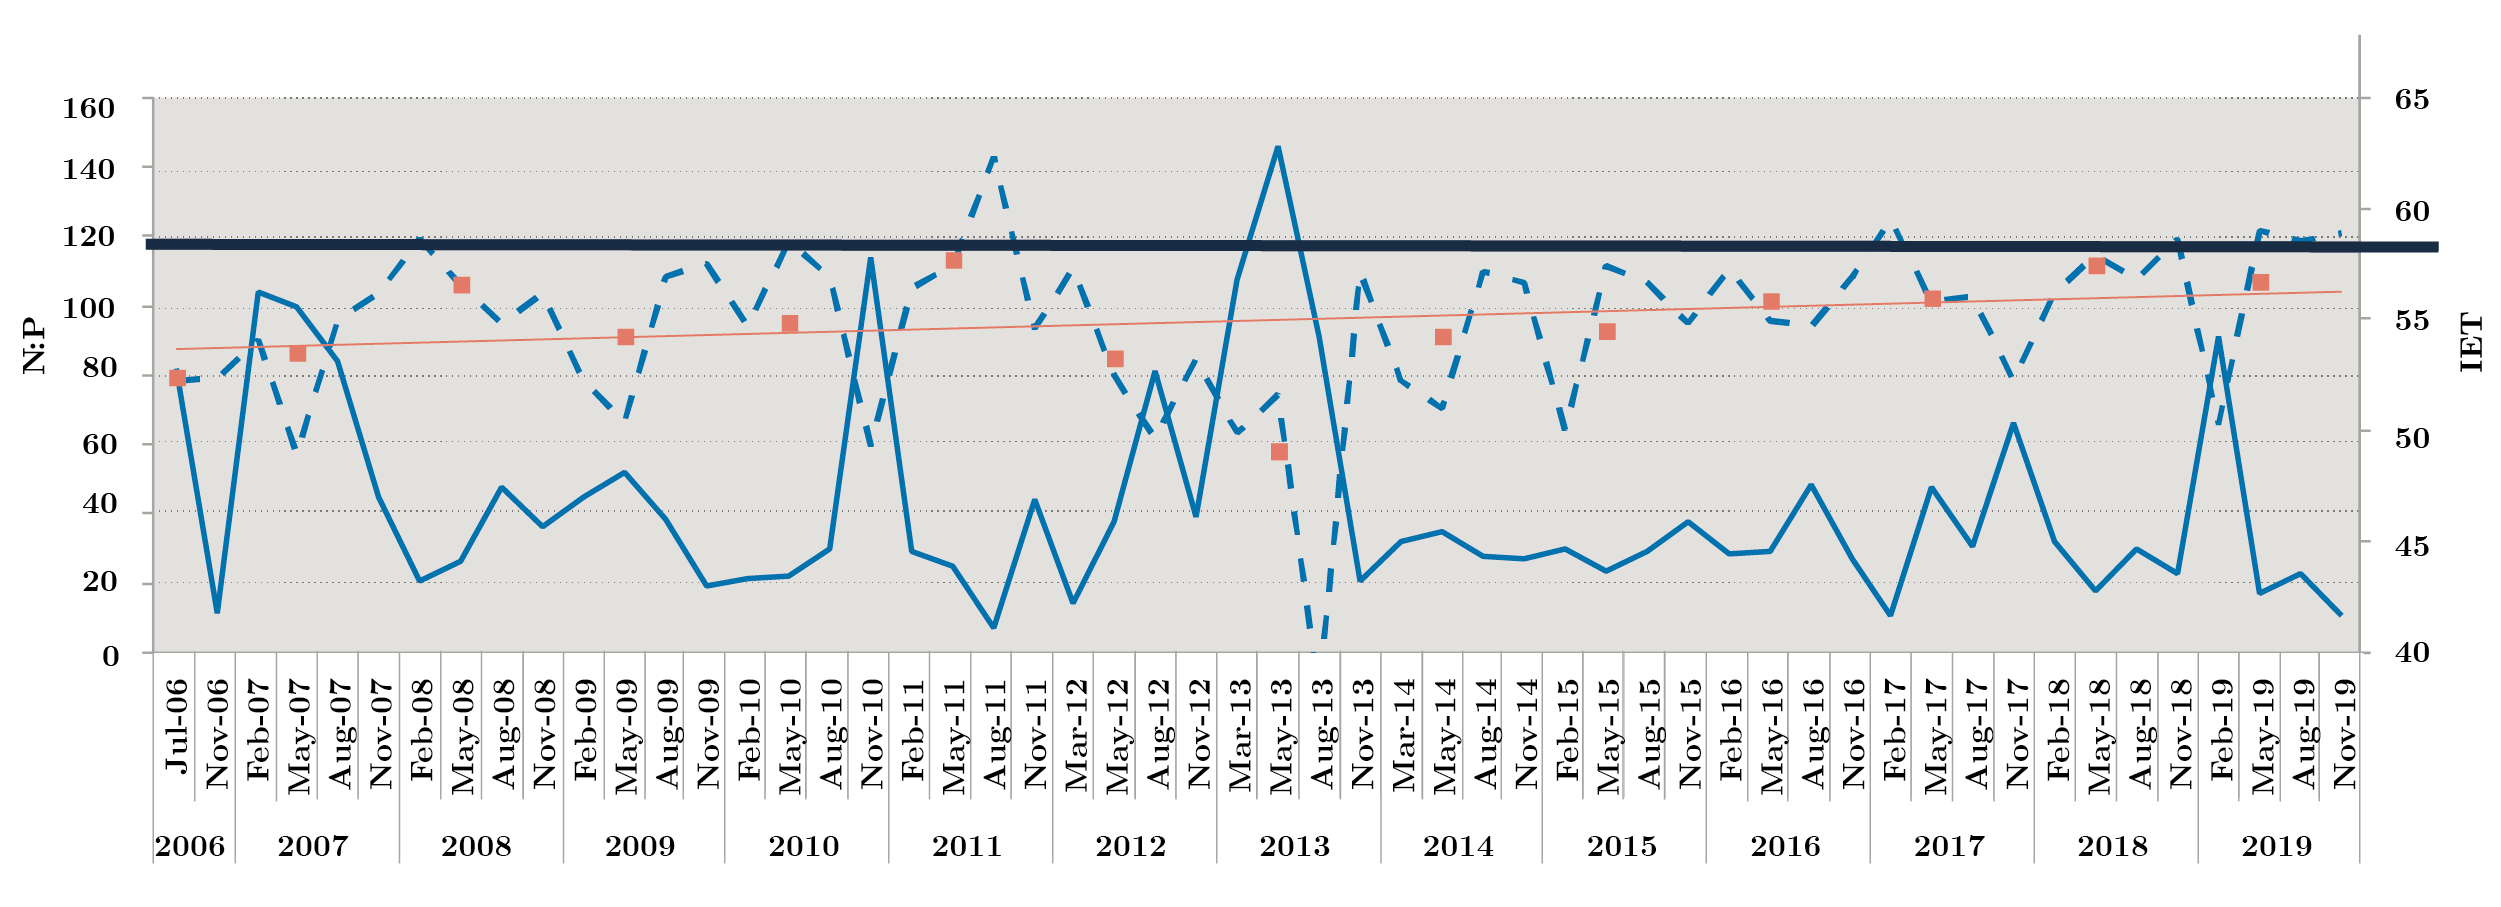
Figura 2. Monthly Redfield ratio N:P (solid line) and monthly trophic status index IET (dotted line) during 2006-2019. Bold solid lines show the limit of 59 for IET. Above, eutrophic state is indicated. Orange squares: annual average and orange line: tendency line.
The atomic Redfield ratio showed no nitrogen limitation condition for phytoplankton growth. Most of the time, the ratio was values above 20, but in Nov-06, Aug-11, Feb-17 and Nov-19, this ratio was below 16 at times when PT concentration was above 100 µg l-1 (Figure 2).
Phytoplankton diversity biomass and chlorophyll a
During the study period, from July 2006 to November 2019, 422 taxa of algae and cyanobacteria were recorded at three selected sites (Annex 1). The phytoplankton groups were: Cyanobacteria, Bacillariophyta, Chlorophyta s.l., Zygnemaphyta, Cryptophyta, Chrysophyta, Dinophyta, Euglenophyta, Raphidophyta, Xanthophyta, and undetermined flagellates. For the purpose of graphics, an additional group called “Others” composed of Chrysophyta, Dinophyta, Euglenophyta, Raphidophyta, Xanthophyta and undetermined flagellates were grouped together.
The diatoms presented the highest number of taxa (158), followed by the Chlorophyta s.l. with 95 taxa, including 55 green coccal algae, 56 Euglenoids (Annex 1). Cyanobacteria were represented by 49 taxa. From a total of 158 diatoms recorded, 134 taxa belonged to pennates and 24 taxa to centric diatoms. During high flow periods, most of the diatom taxa were tychoplankton. Dinoflagellates were represented with 18 taxa and Cryptophyta and Crysophyta with 9 taxa each. Raphidophyta was represented with the species Gonyostomum semen (Annex 1).
The lowest number of taxa per sample (4) were found in winter 2008 (NB), winter 2009 (LC), spring 2008 (FB and LC) and in autumn 2010 (NB and LC). The highest taxa number per sample (69) was found in summer 2016 and 2013: 52 taxa both NB, followed by 43 taxa in LC and 42 in FB. The genera Nitzschia and Trachelomonas showed the highest number of species (21 and 17). The diatom Hydrosera whampoensis and the cyanobacteria Jaaginema sp. and Microcrocis sp. were recorded for the first time in Uruguay. The most frequent species, found in more than 30% of the samples were: Plagioselmis lacustris (92,6%), Cryptomonas cf. marssonii (86,6%), Aulacoseira granulata (71,6%), Ankistrodesmus arcuatus (57,8%), Aulacoseira granulata var. angustissima (54,5%), Plagioselmis nannoplanctica (53,5%), Aulacoseira cf. muzzanensis (45%), Cryptomonas cf. ovata, Cryptomonas cf. reflexa (40%), Trachelomonas rugulosa and the centric sp. 1 (30%) that constitute the potamoplankton.
Figure 3 shows phytoplankton carbon biomass variations of the main four groups in each sampling site during the study period. The cryptophytes, cyanobacteria and diatoms were the most representative groups and to a lesser extent, the chlrophytes. The maximum total biomass was 1270 ngC ml-1 in NB (Nov-10). Dolichospermum uruguayense was the most abundant cyanobacteria with 6903 cell ml-1 in low flow conditions (1275 m3 s-1) and high temperature (24.4 ºC). In the same sampling survey in FB and LC, this species, D. uruguayense, was recorded with values of 1414 and 1597 cell ml-1, respectively. In the sampling of spring 2010, high values of the three parameters were recorded in FB (8073 cell ml-1, 126.8 ngC ml-1, 9.2 µ gl-1) and in LC (5734 cell ml-1, 132 ngC ml-1, 7.0 µg l-1), although the most abundant species was the cyanobacteria Pseudanabaena mucicola. Another high peak of phytoplankton abundance occurred in summer 2008 in NB (9497 cell ml-1, 347 ngC ml-1, 6.8 µ gl-1) when the flow was 2861 m3 s-1 and the temperature reached the highest value (28 ºC). In this opportunity, the dominant Cyanobacteria was Microcystis aeruginosa with 6705 cell ml-1 (Figure 3).
Only three phytoplankton biomass peaks of other groups occurred, almost 130 ngC ml-1 (Aug-08 and 09, Feb-13 in NB) with 99% of Crytophyta and 126 ngC ml-1 (Feb-15, NB) of Chlorophyta (Eudorina elegans). In the summer of 2017 and 2019, the biomass of “other groups” increased through the presence of the dinoflagellates and euglenoids species. Big size species, like Ceratium and Trachelomonas, contributed to the total biomass (Figure 3).
Extra monitoring samples in the summer due to a cyanobacterial bloom were taken at the Fray Bentos site. In 2006, the highest microcystin-LR was recorded with 2010 µg l-1 in a M. aeruginosa bloom. In 2009, the values were 6.2×10⁶ cell ml-1. M. aeruginosa represented 90% of the total abundance followed by D. uruguayense, M. wesenbergii and D. circinale. The other case was in spring 2010, when a high concentration of microcystin-LR was recorded at the FB site with 10.4 µg l-1. In this bloom, M. panniformis reached 1.66×10⁶ cell ml-1 and D. uruguayense was observed with values of 2×10⁵ cell ml-1 at the NB site. Recently, in 2012 in FB Remeros marina, M. aeruginosa reched 8.5×10⁶ cell ml-1.
Other potentially toxic species began to be registered in 2009: Raphidiopsis mediterranea and R. raciborskii in spring of 2014, reaching 1041 cell ml-1 in spring 2017. Cuspidothrix sp., Microcrocis sp. and Aphanizomenon gracile appeared in the summer 2015.
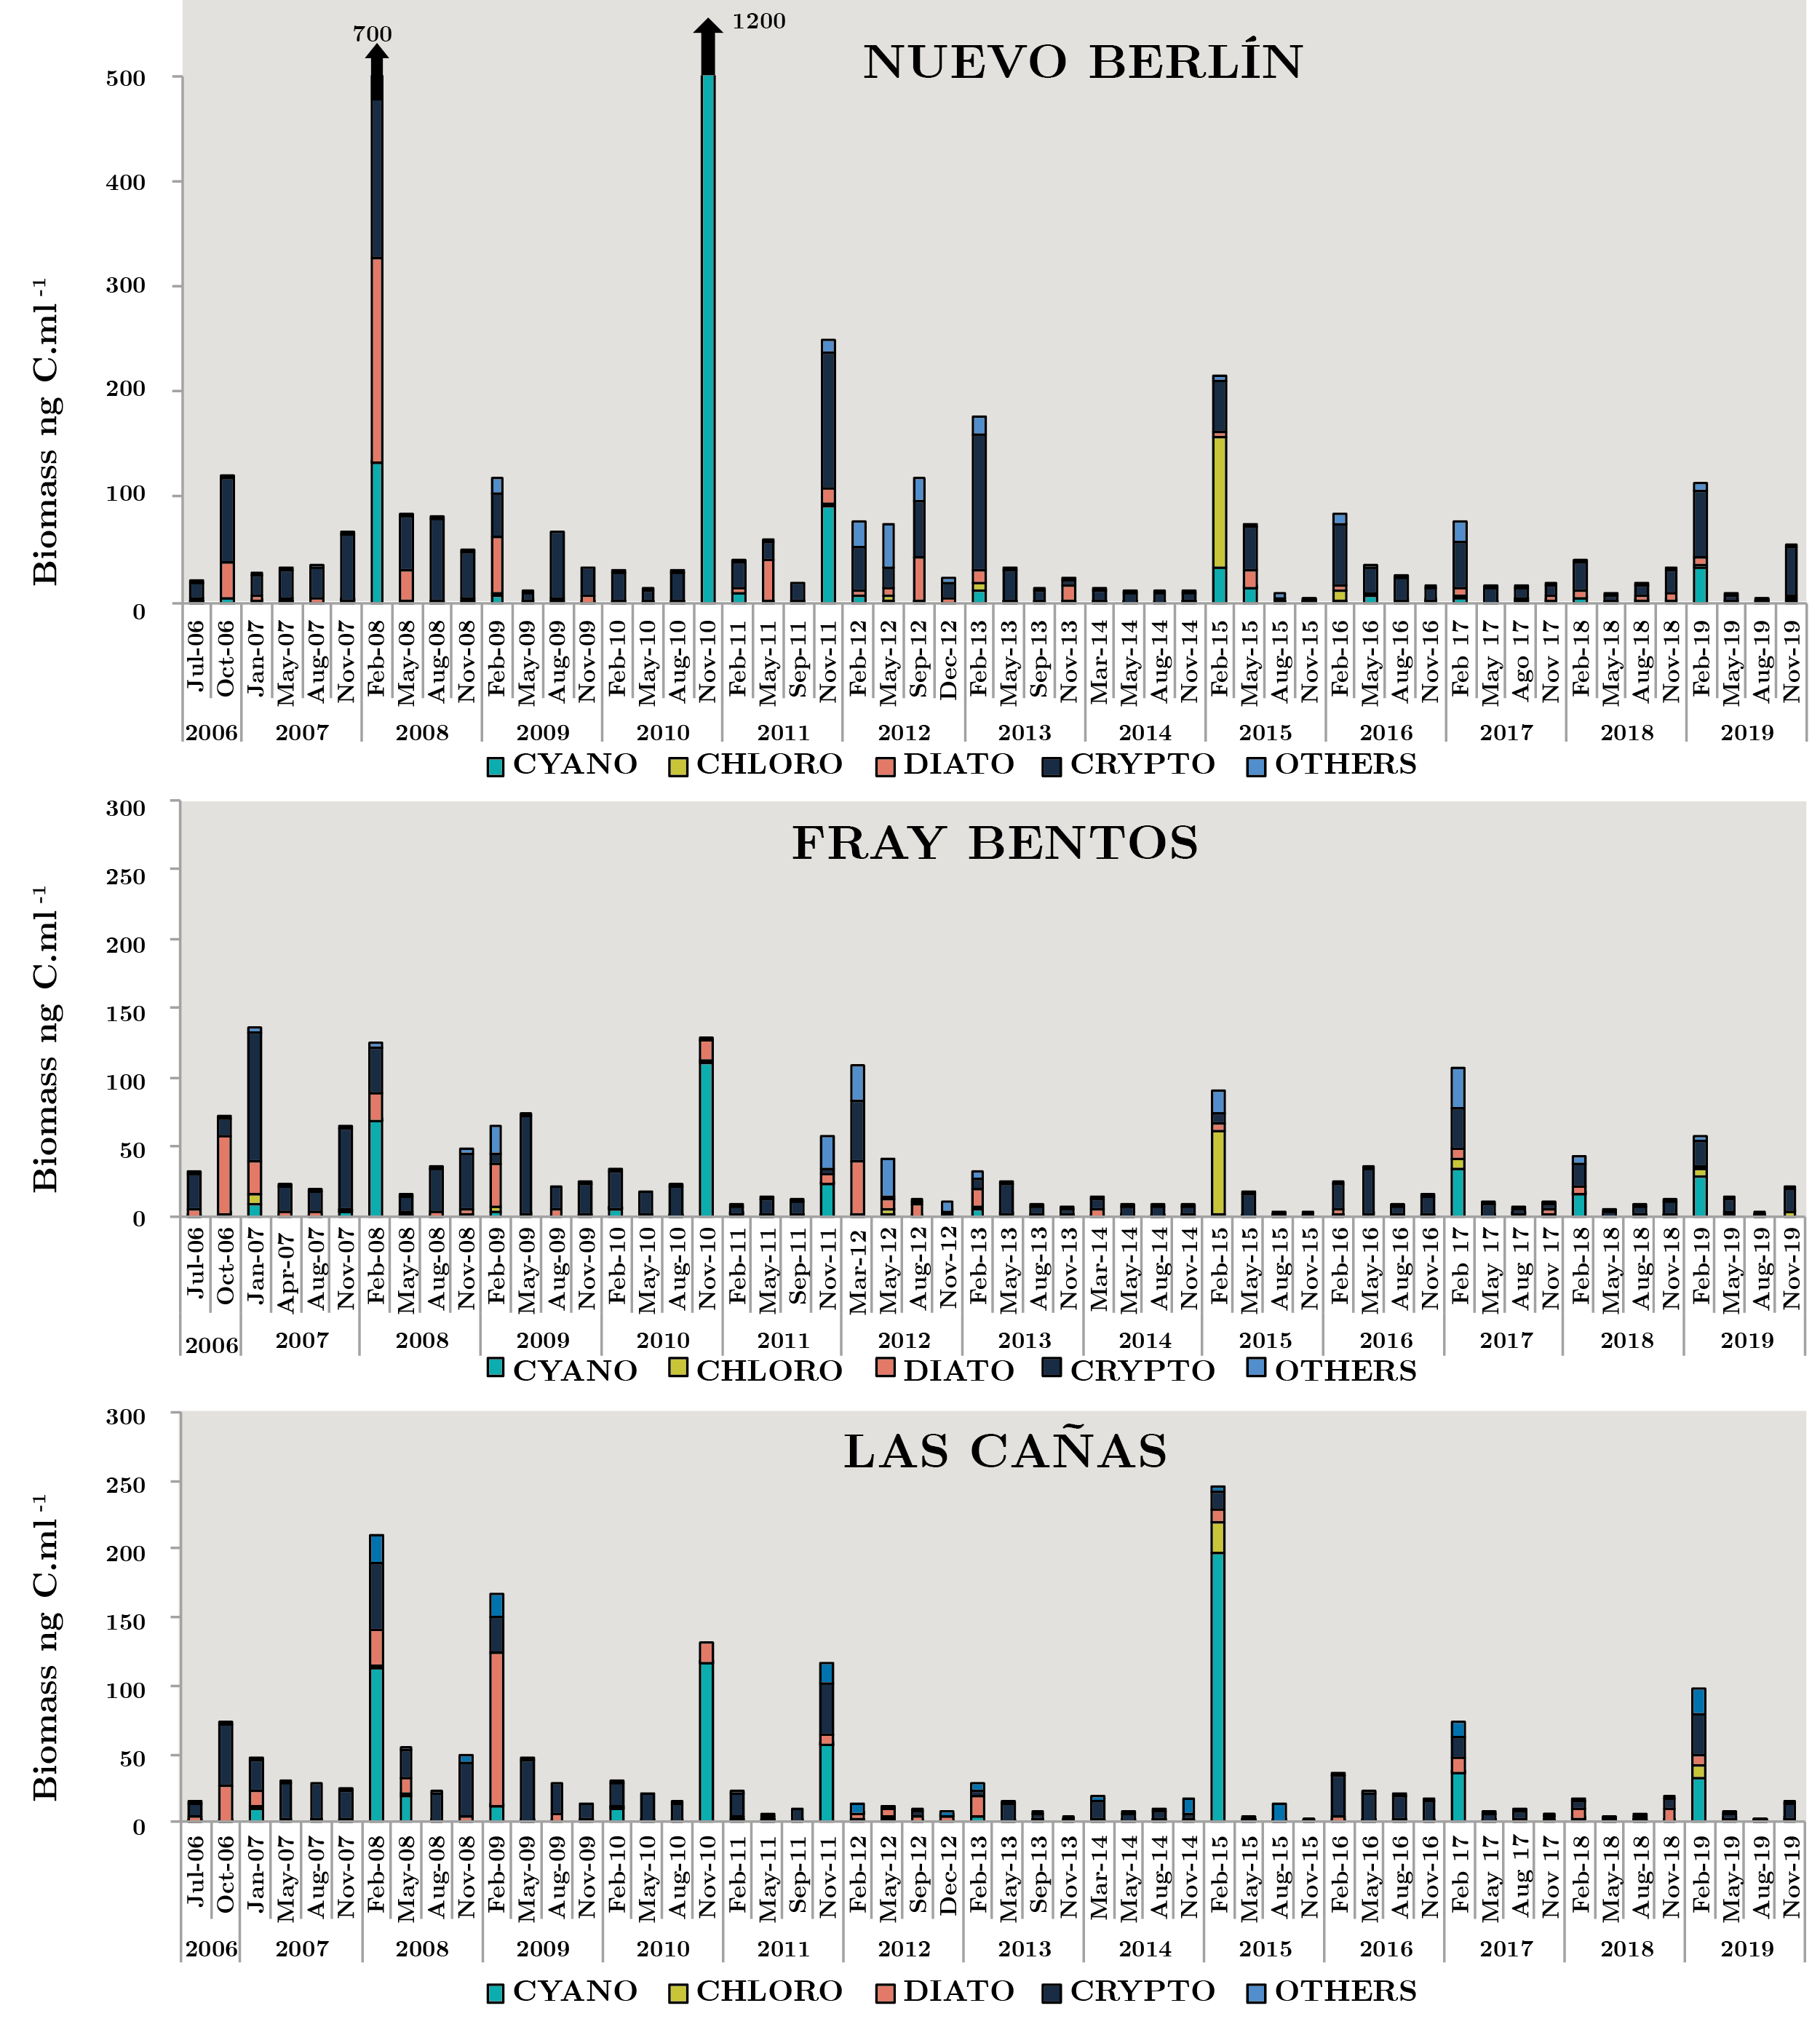
Figura 3. Monthly average carbon biomass (ngC ml-1), for each group: Cyanobacteria (CYANO), Chlorophyta (CHLORO), Bacillariophyta (DIATO), Cryptophyta (CRYPTO) and OTHERS for each sampling between July 2006 and November 2019 on sites: Nuevo Berlín (NB), Fray Bentos (FB) and Las Cañas (LC).
Spearman’s correlation coefficient showed high correlation between abundance and carbon biomass (r = 0.52) while relatively low with secchi disc (cc = 0.25), temperature (cc = 0.26) and flow (-0.16). Bubble biplots are used to highlight the relationship between flow and temperature in phytoplankton biomass. The diagram shows that the highest biomass was recorded at the highest temperatures and with flow rates of less than 2000 m3 s-1 (Figure 4).
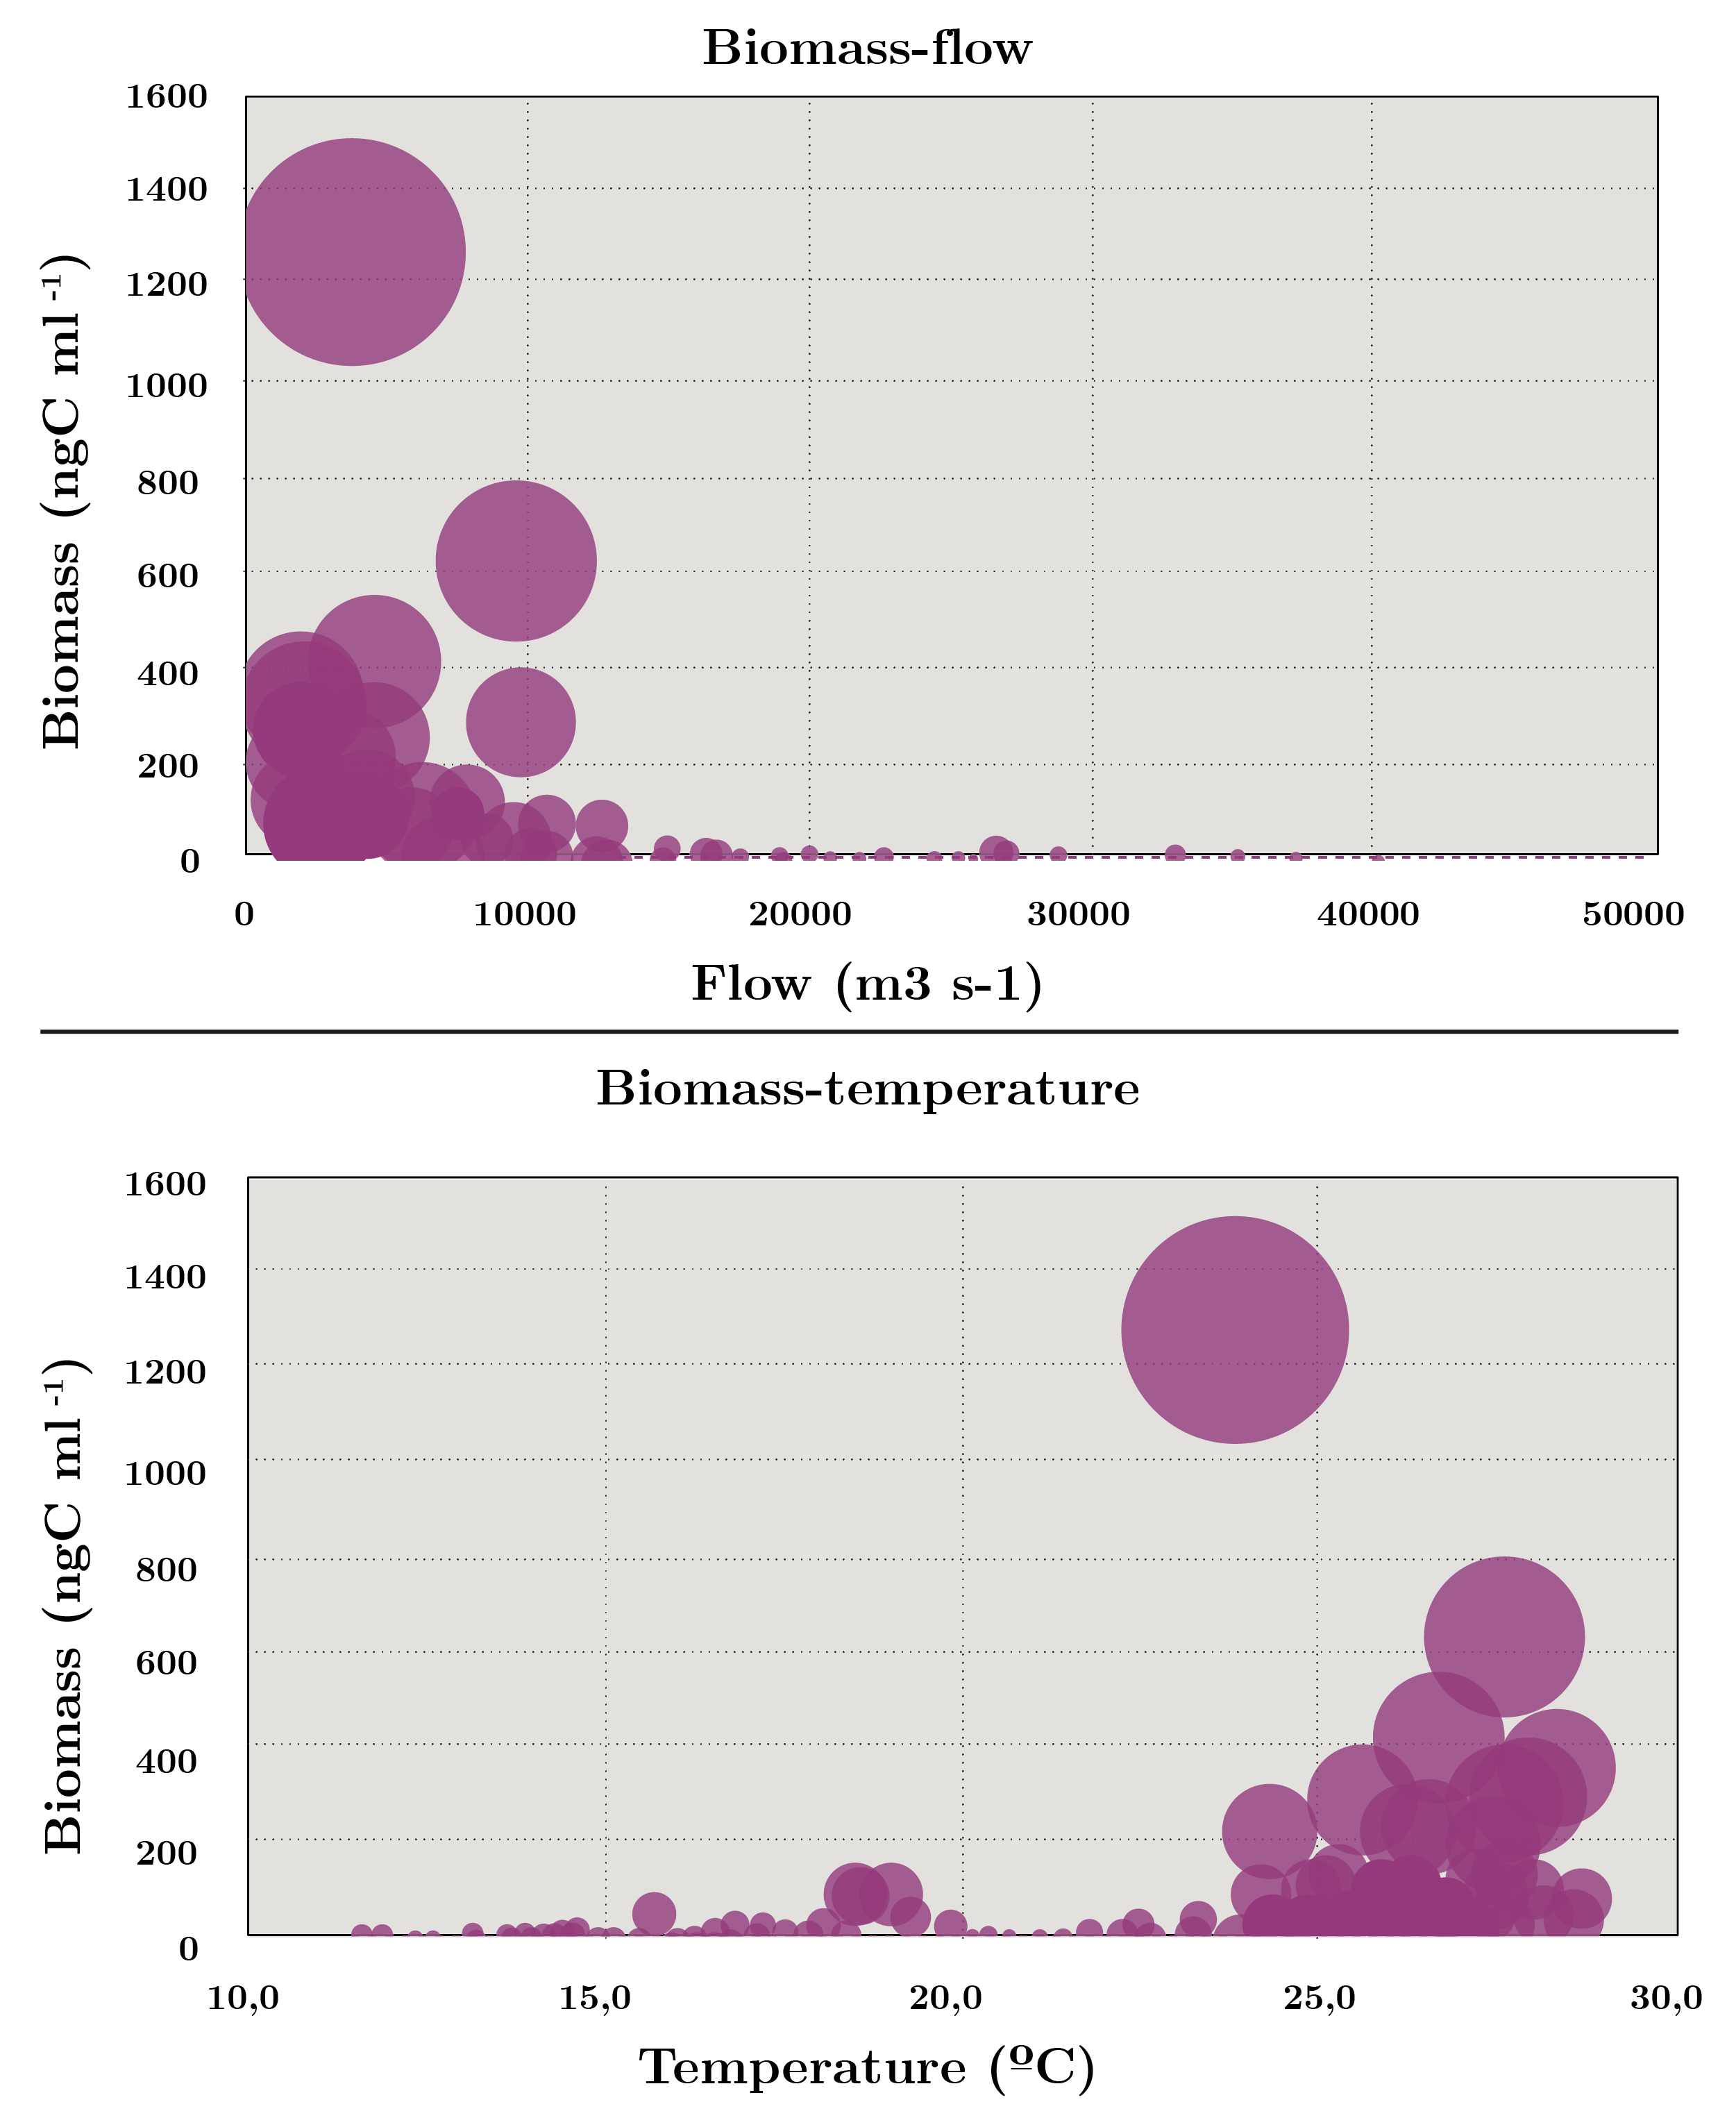
Figura 4. Increasing bubble diagram showing total biomass (ng C ml-1) with regards to flow (m3 s-1) and temperature (ºC) during July 2006 - November 2019.
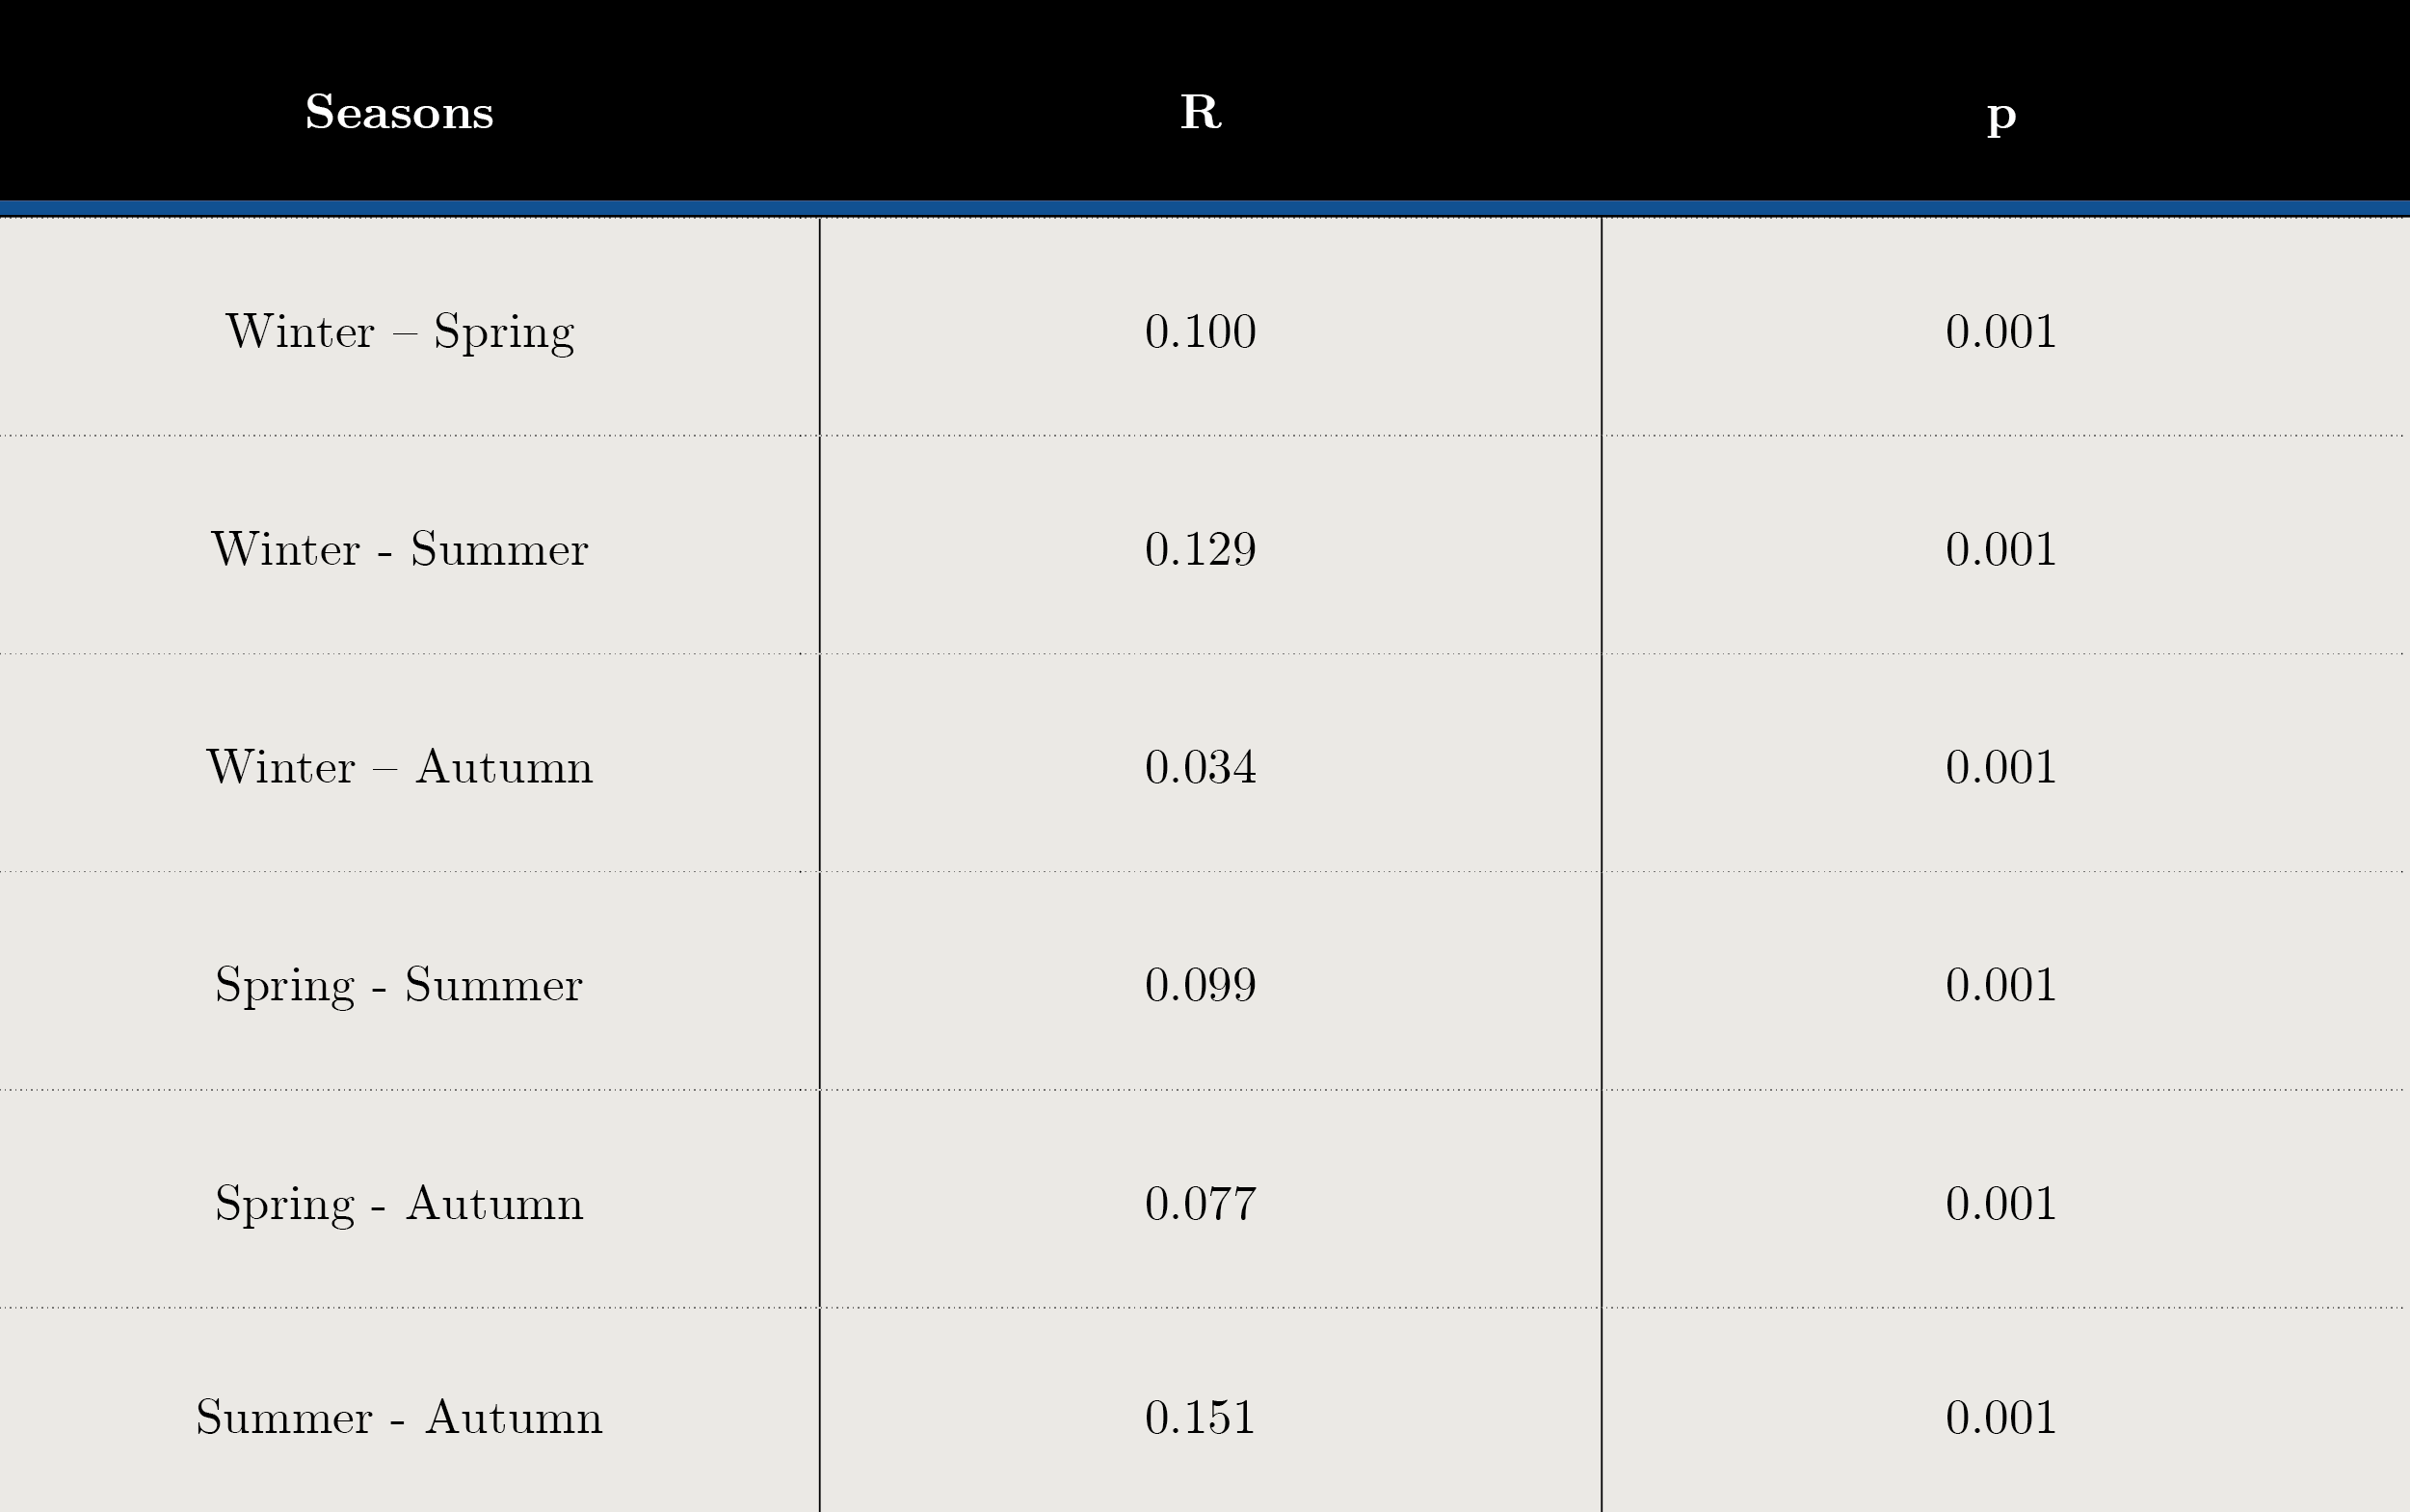
Tables 2 and 3 show the SIMPER analysis carried out with carbon biomass values. A. granulata was present in all seasons throughout the sampling period. The typifying species for each season were: Aulacoseira spp. in winter, Dolichospermum uruguayense, Durinskia baltica and Ankistrodesmus arcuatus for spring, the cyanobacteria Microcystis aeruginosa, M. wesenbergi and Dolichospermum uruguayense and D.circinale in summer, and Ceratium cf. furcoides, A.arcuatus, Raphidiopsis and Jaginema sp. in autumn. (Table 2). The discriminant species for winter-spring were Dolichospermum uruguayense and Ceratium cf. furcoides, for summer-winter, M. aeruginosa and Ceratium cf. furcoides and for summer-autumn, D. uruguayense and C. furcoides (Table 3). There were significant differences between seasons (ANOSIM, Global R: 0.085; p = 0.001) (Table 4).
Tabla 2. Summary of SIMPER results. Species contributions in each season. Average similarity (Av. Sim.) of typifying species in each season, their contribution (%) to the within-group similarity, and cumulative total (%) of contributions.
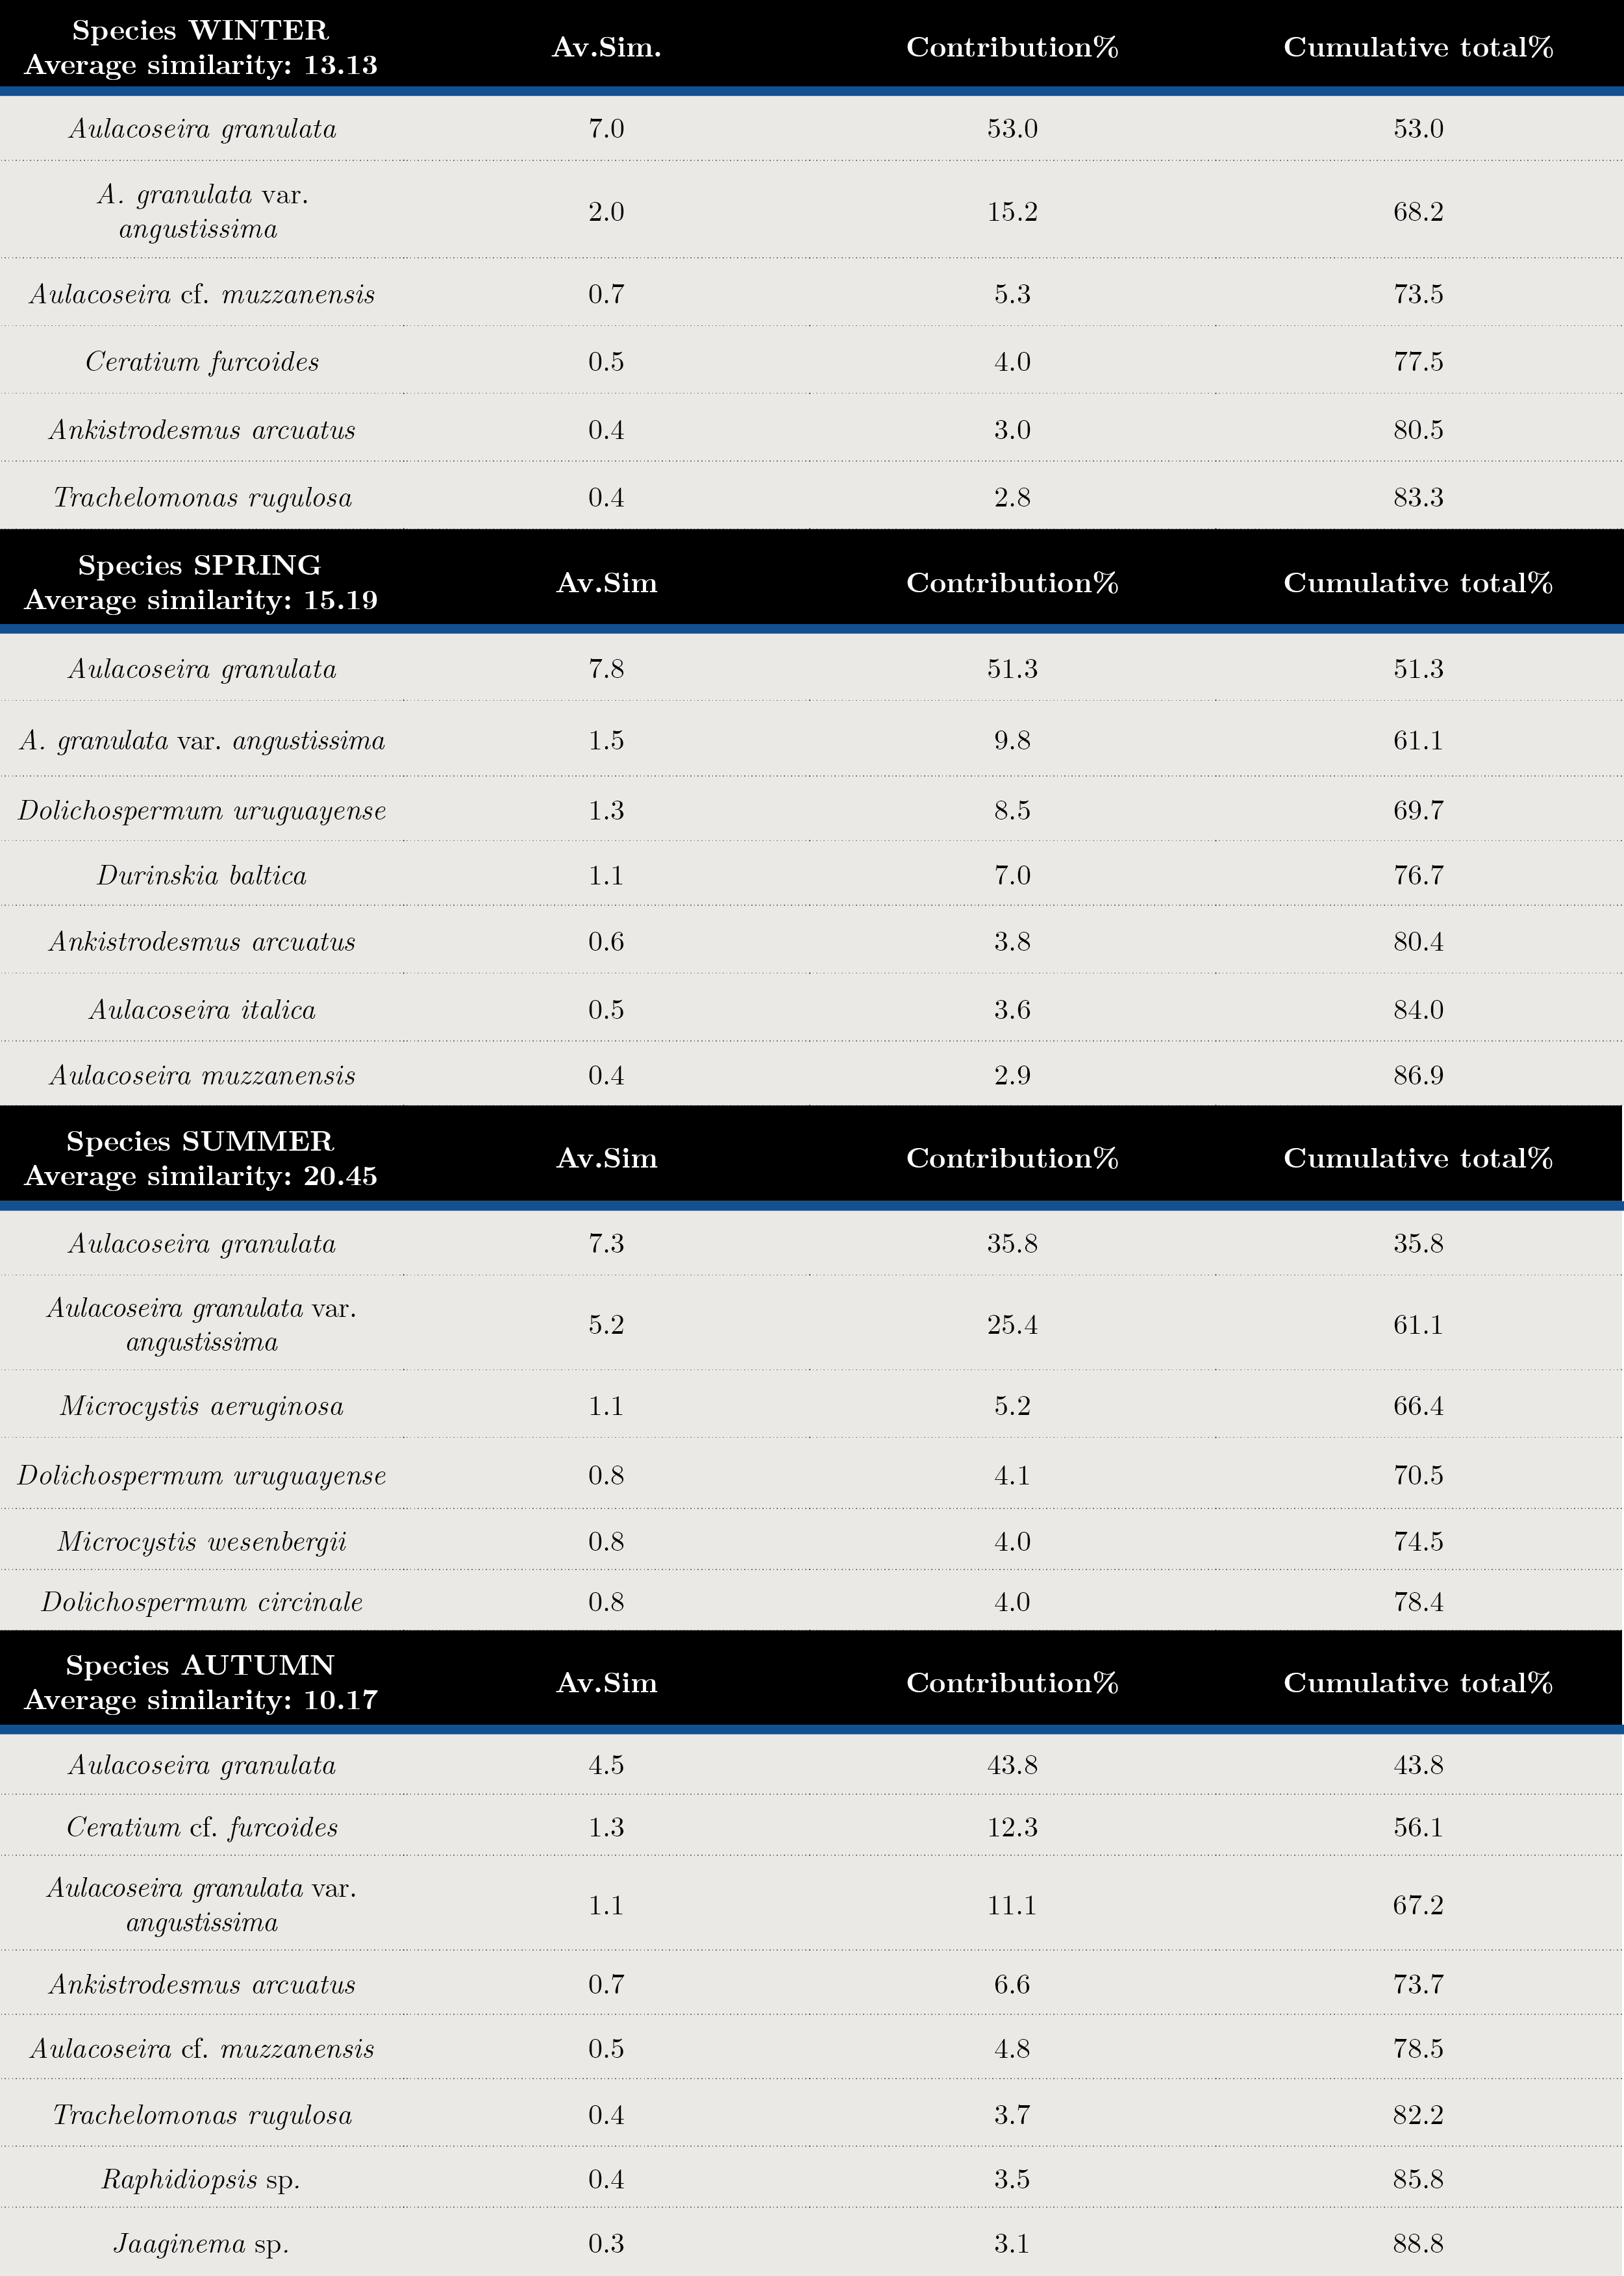
Tabla 3. Average Dissimilarity percentages (Av. Diss) and species contributions (%) in each season. Discriminant species by group determined by SIMPER analysis with biomass matrix.
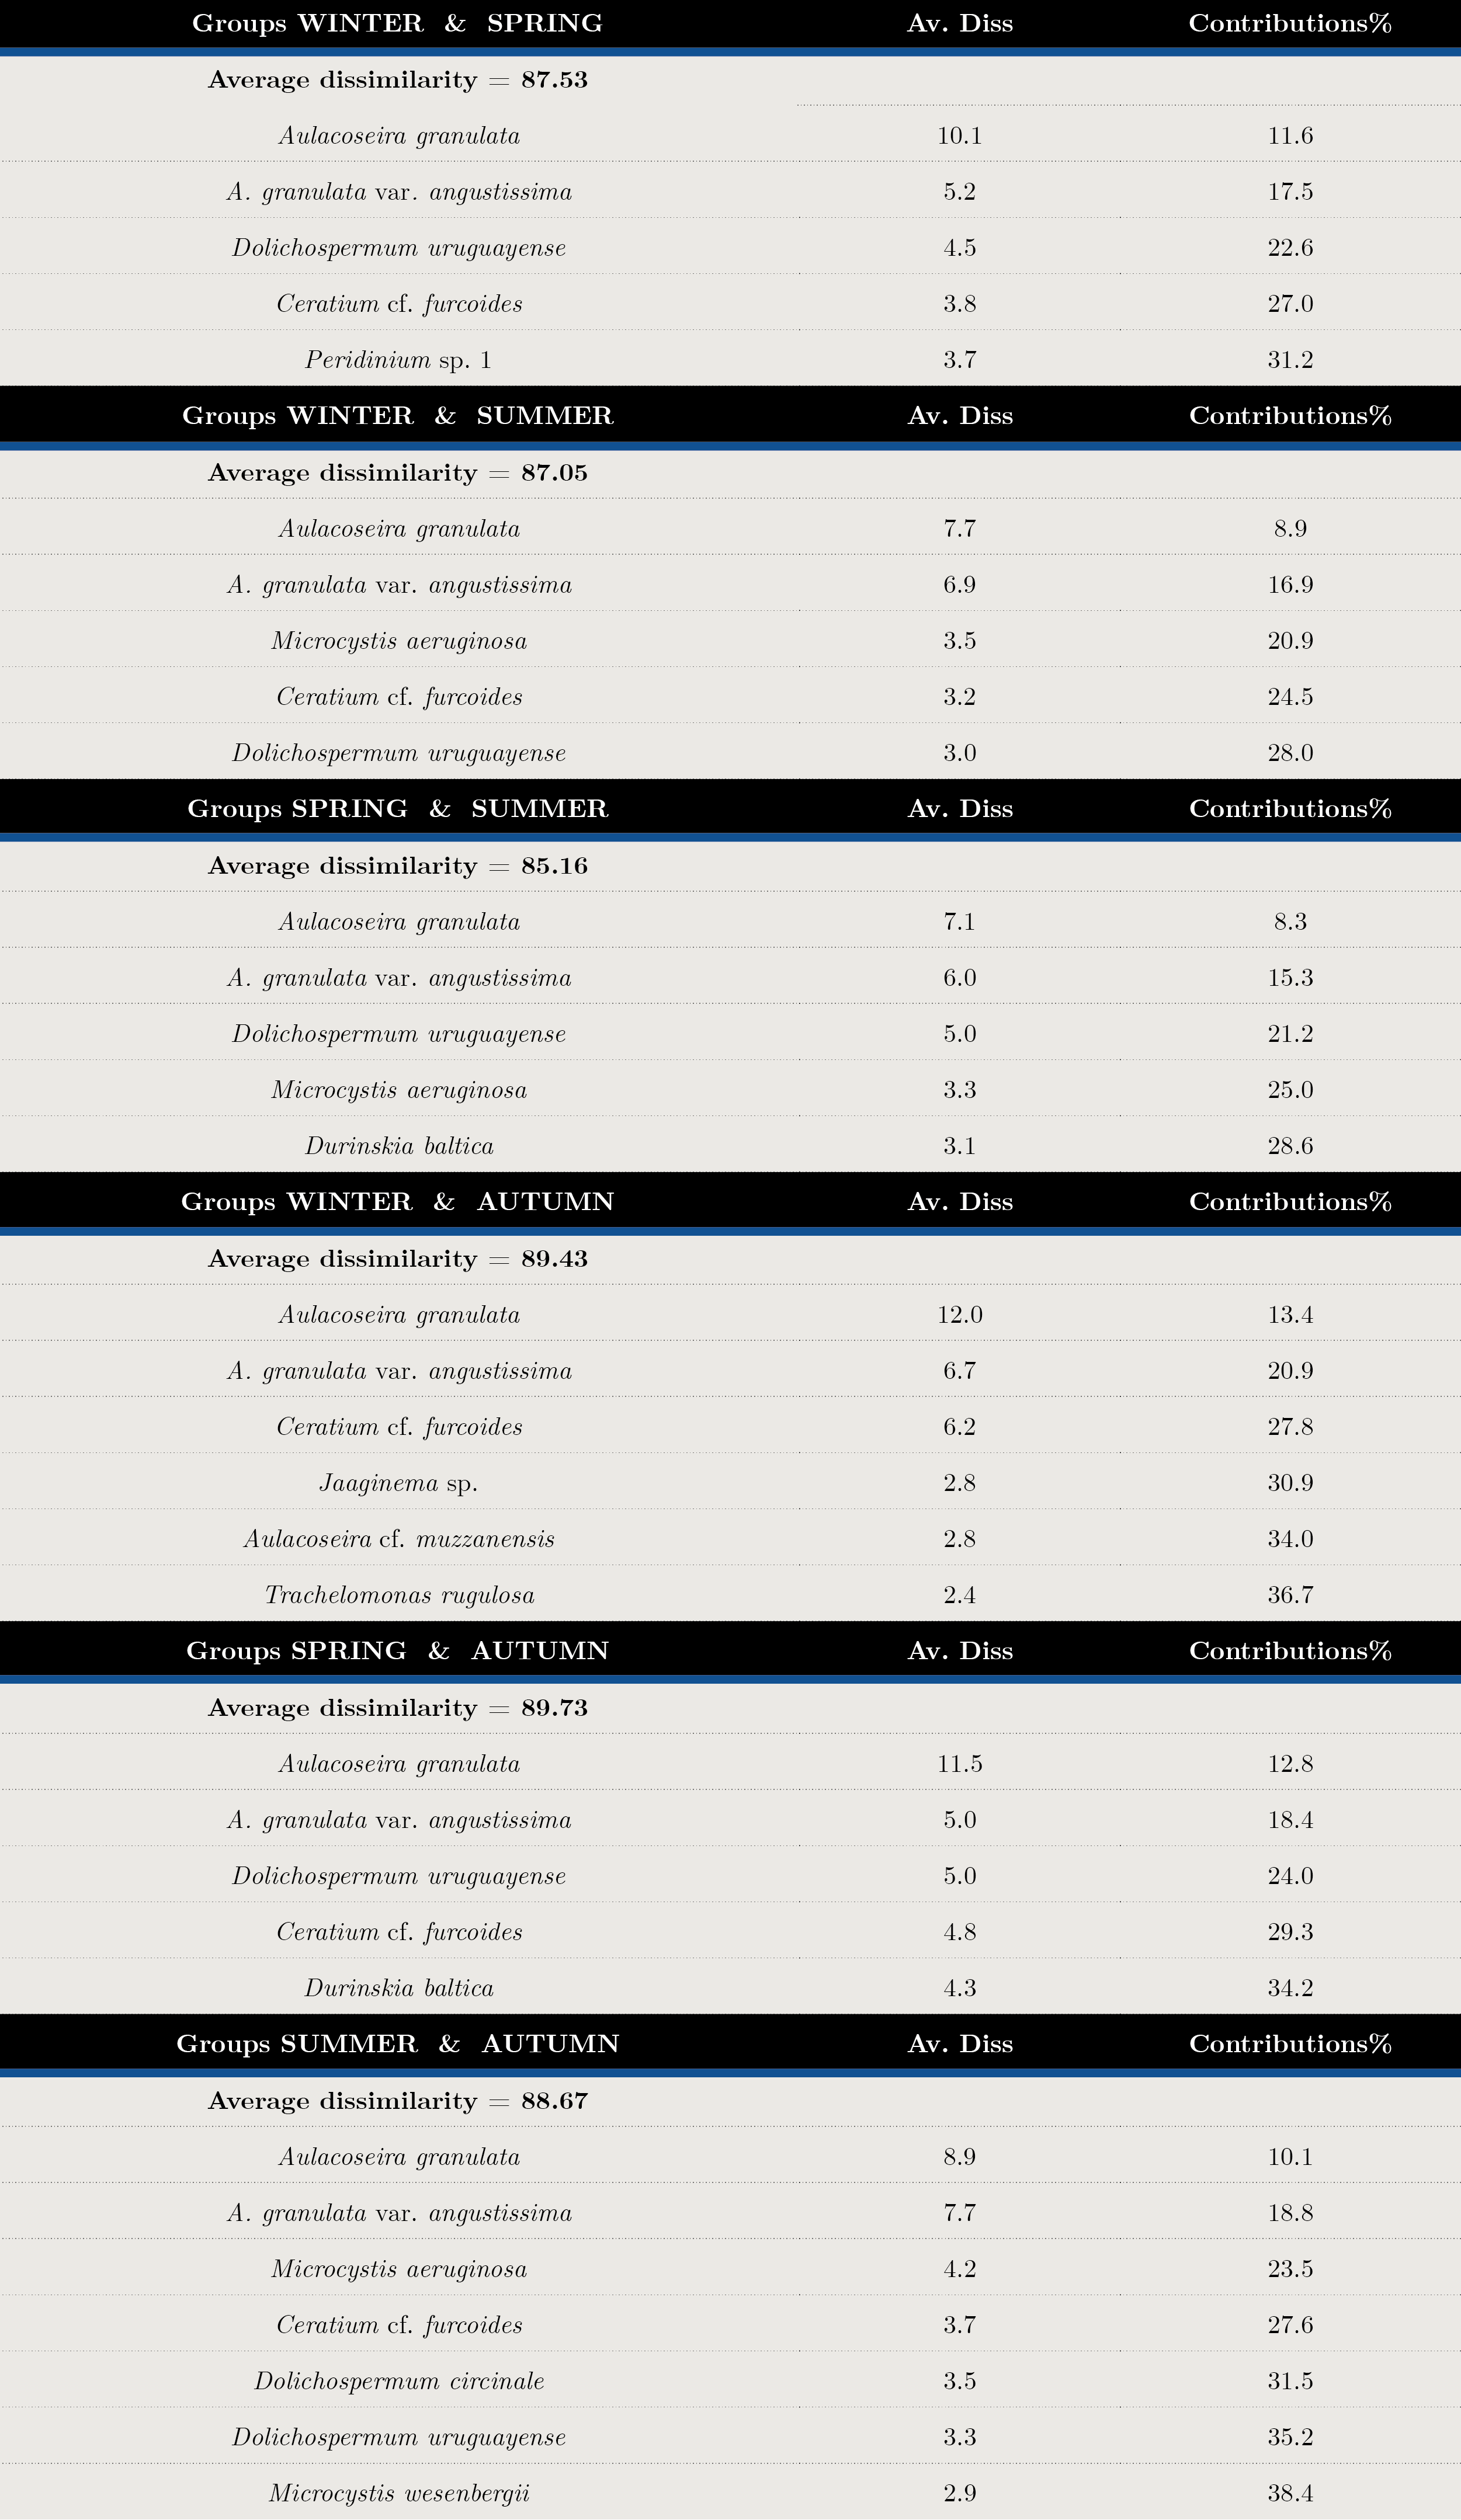
Tabla 4. Analysis of Similarity (ANOSIM) results of biomass matrix for each season. R statistic (Global R) and significance level of sample statistic: p< 0.001
Correlation between environmental variables and carbon biomass
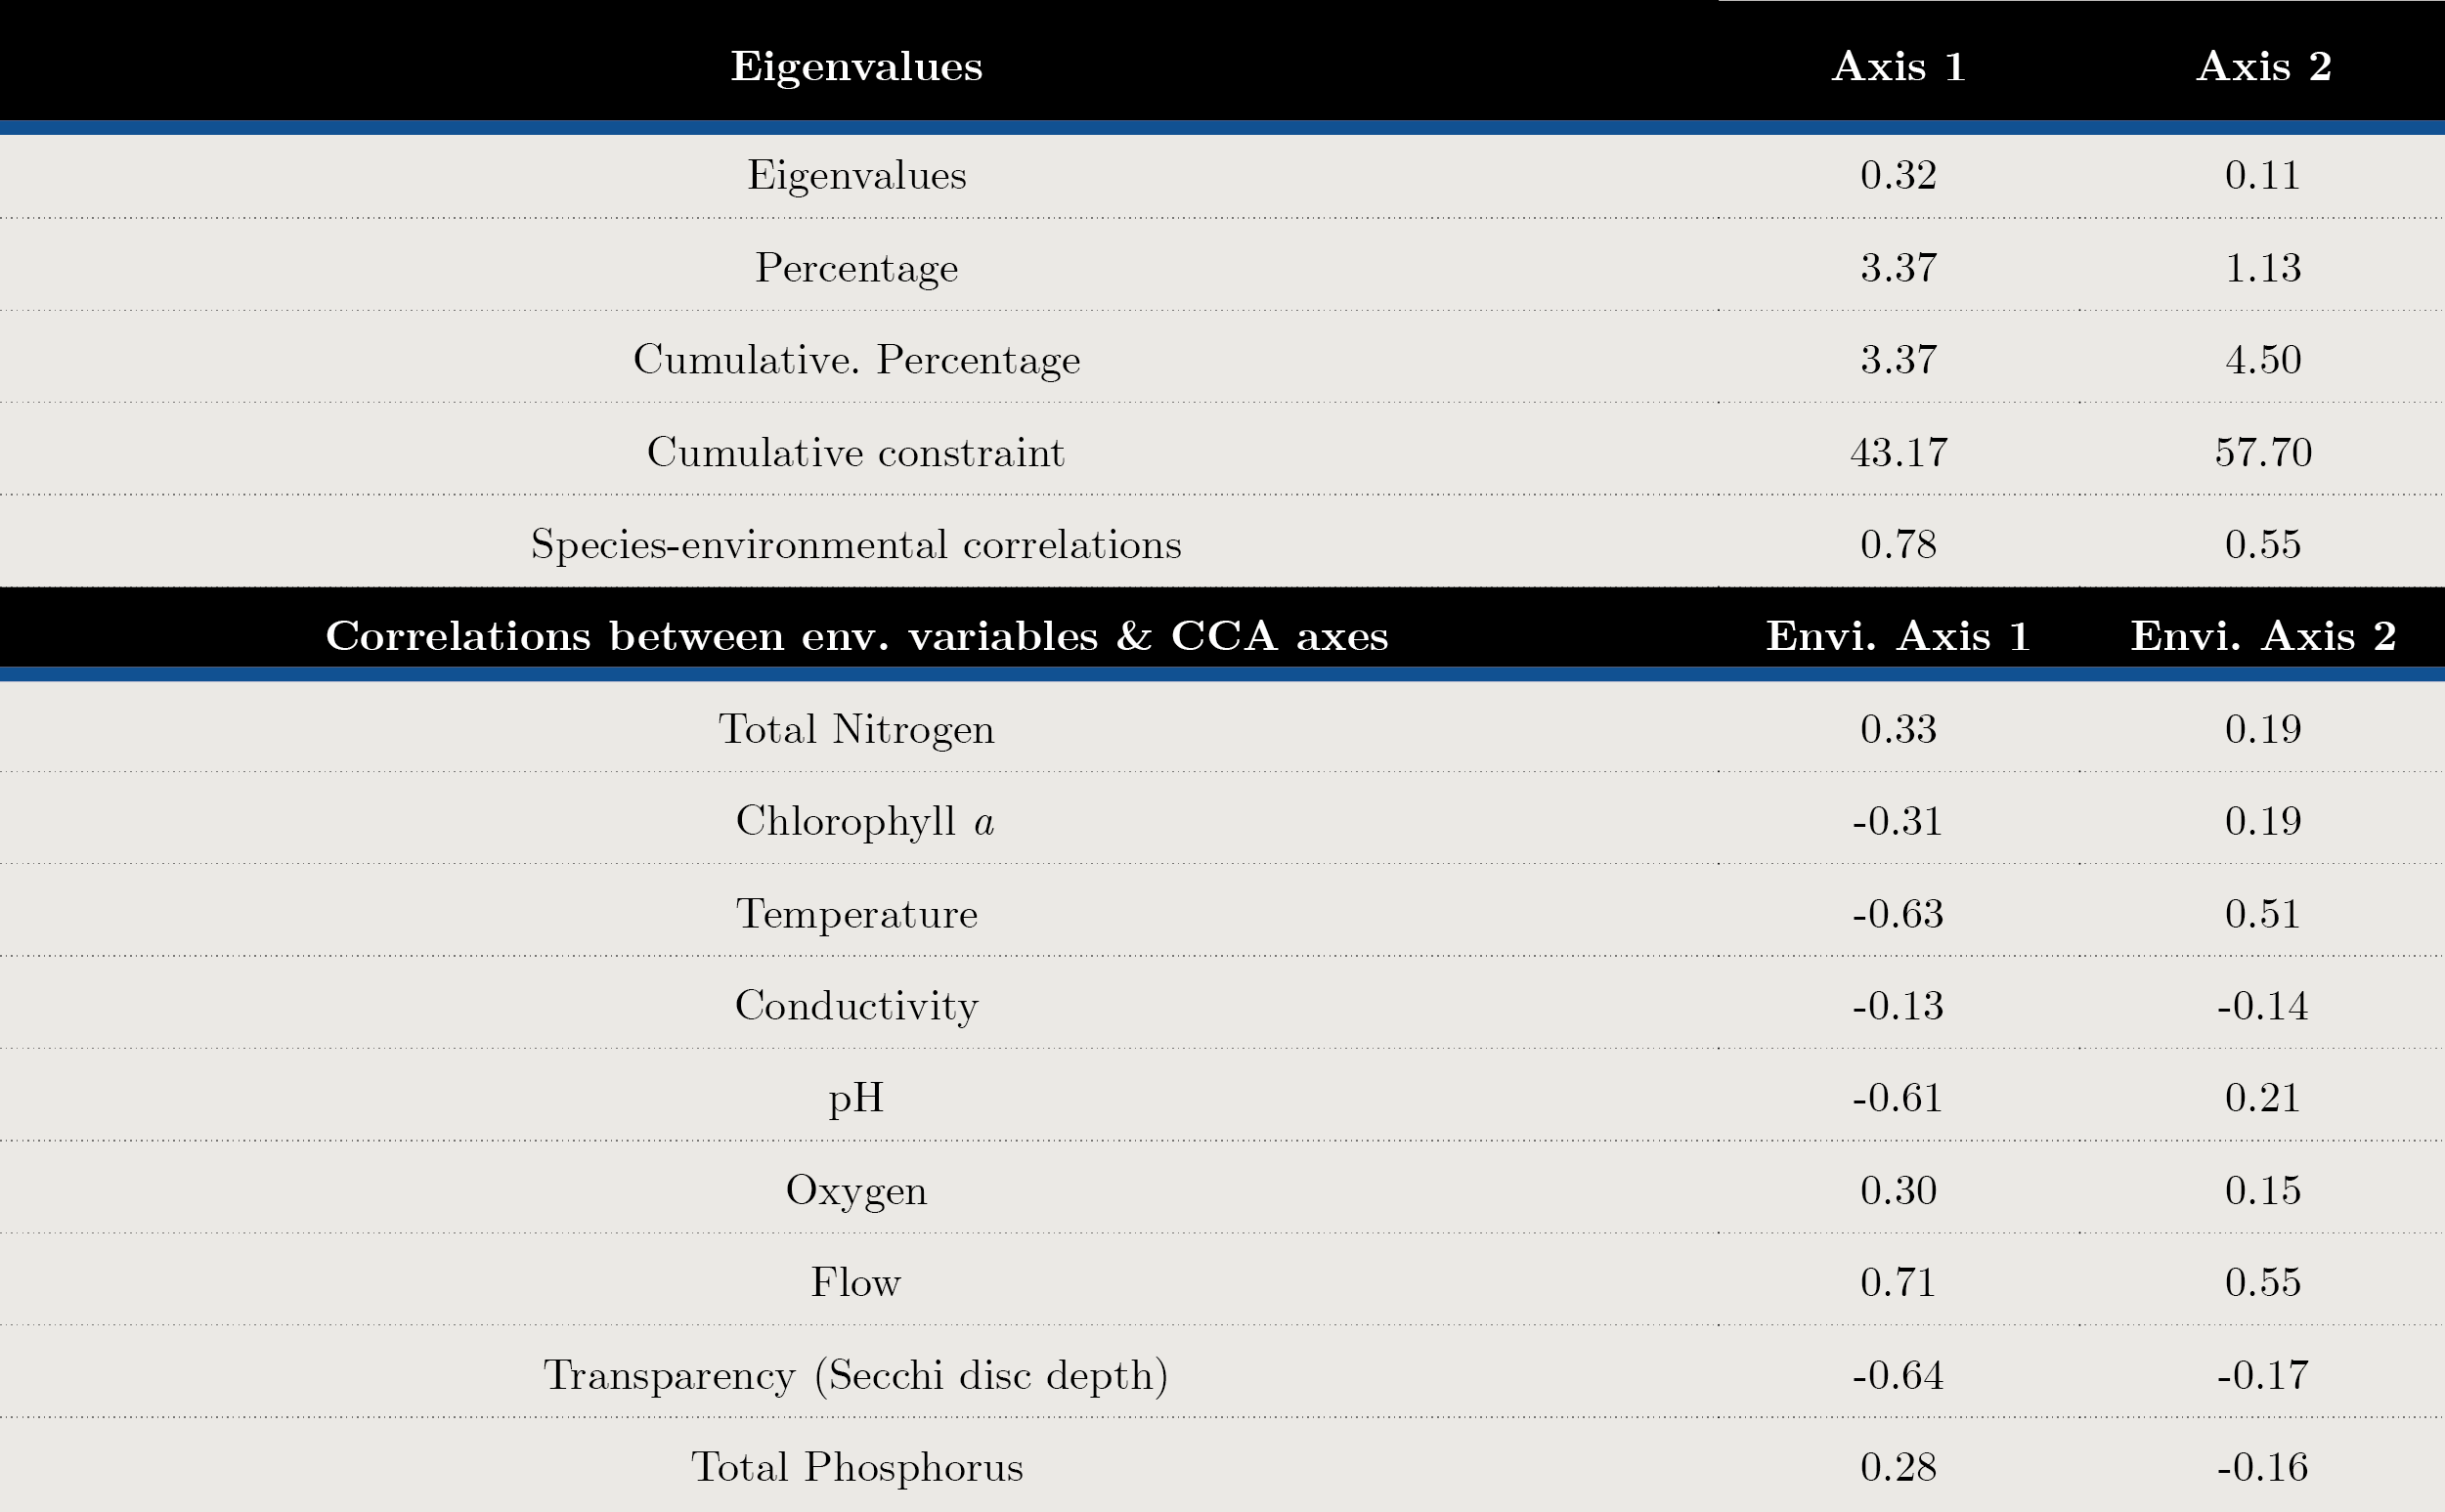
Transparency, flow and temperature were the most important variables explaining phytoplankton structure. According to the CCA analysis, 57.7% of the total variance was explained in the first two axes. The variables that contributed to the first axis were flow (cc = 0.71), Secchi disc depth (SD cc = -0.64) and temperature (cc = -0.63) (Figure 5 y Annex 2).
There was a positive correlation between the euglenoids Lepocinclis caudata, Trachelomonas planctonica, the diatoms Ulnaria ulna, the dinoflagellate Ceratium furcoides and the cyanobacteria Jaaginema and Raphidiopsis mediterranea with flow and total phosphorus and nitrogen, while cyanobacteria (Dolichospermum cf. planctonicum, D. uruguayense and Microcystis spp.) correlated with temperature, pH, Chl a and transparency (SD) (Figure 5).
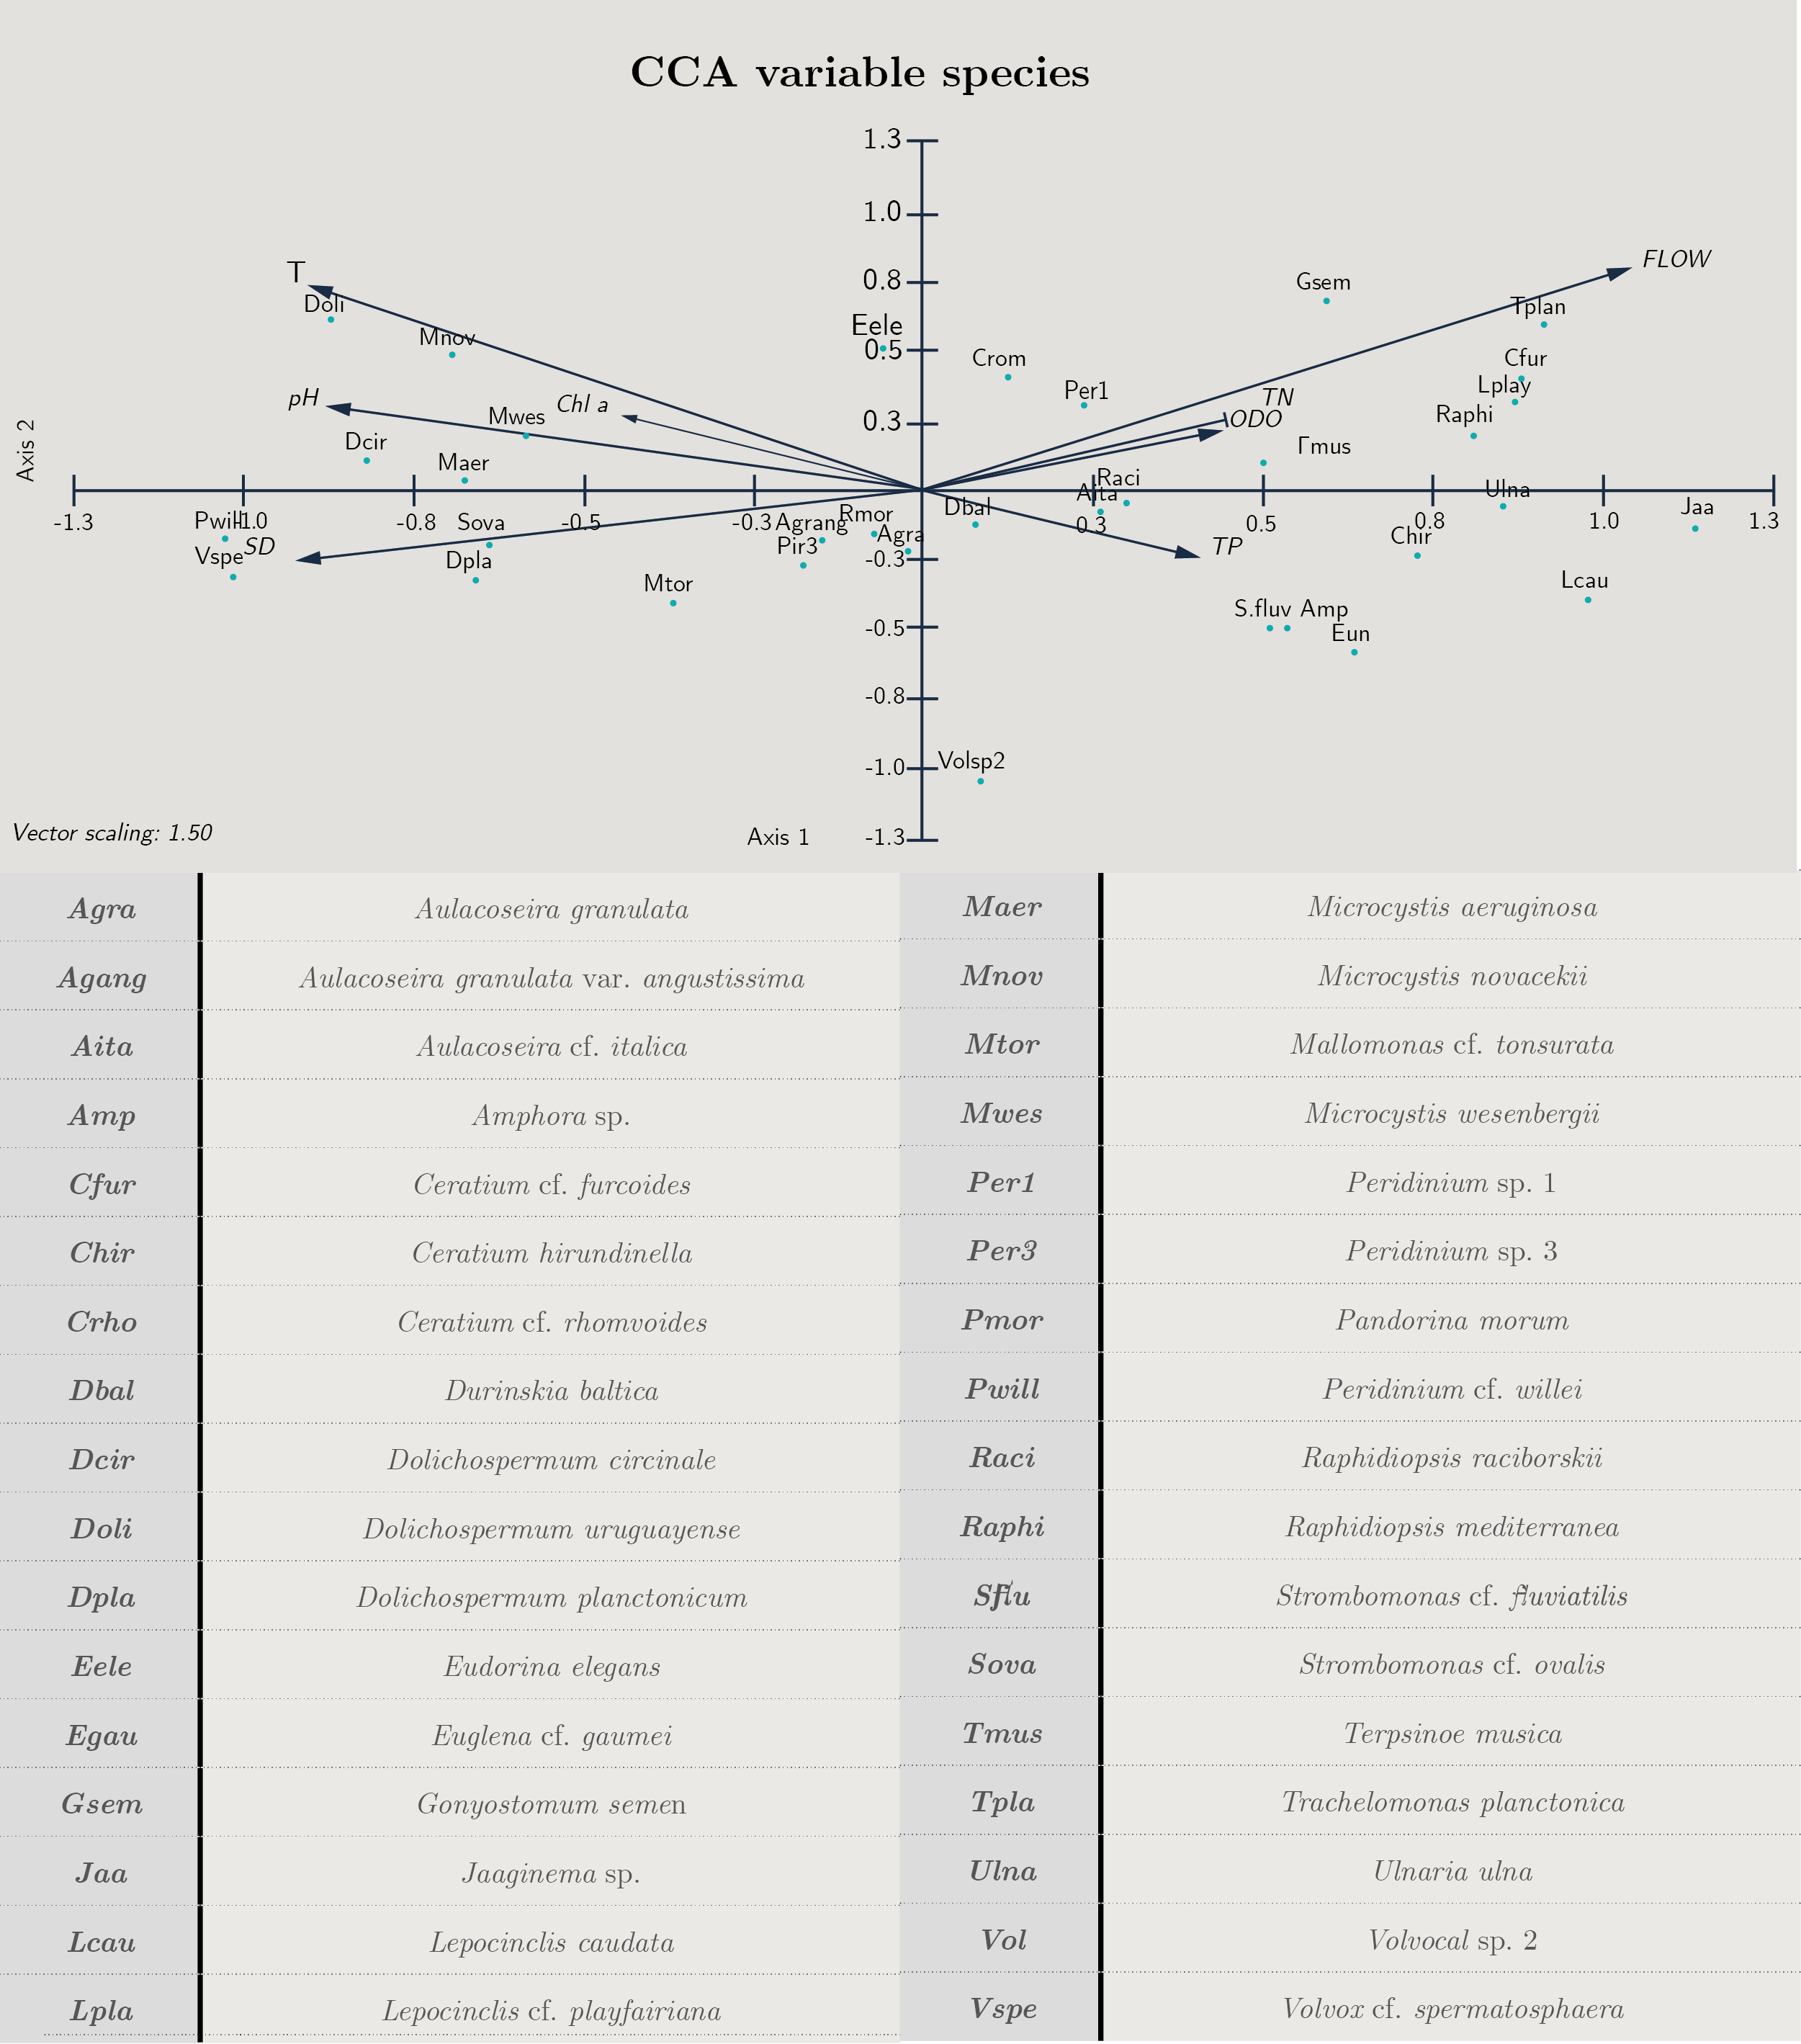
Figura 5. Biplot diagram Canonical Correspondence Analysis for species with biomass over 25%. Cond: conductivity, T: temperature, pH, TN: total nitrogen, TP: total phosphorus, SD: Secchi disc, Chl a: chloro-phyll a, ODO: oxygen and flow. Code of species are presented.
The river flow fluctuated from 2006 to 2019 a minimum of 522 m3 .s-1 (February 2008) to a maximum of 56070 m3 .s-1 (May 2017) showing several peaks. When flow rate decreased, transparency increased, favoring the development of phytoplankton, increasing the biomass during the summer period (Figure 6).
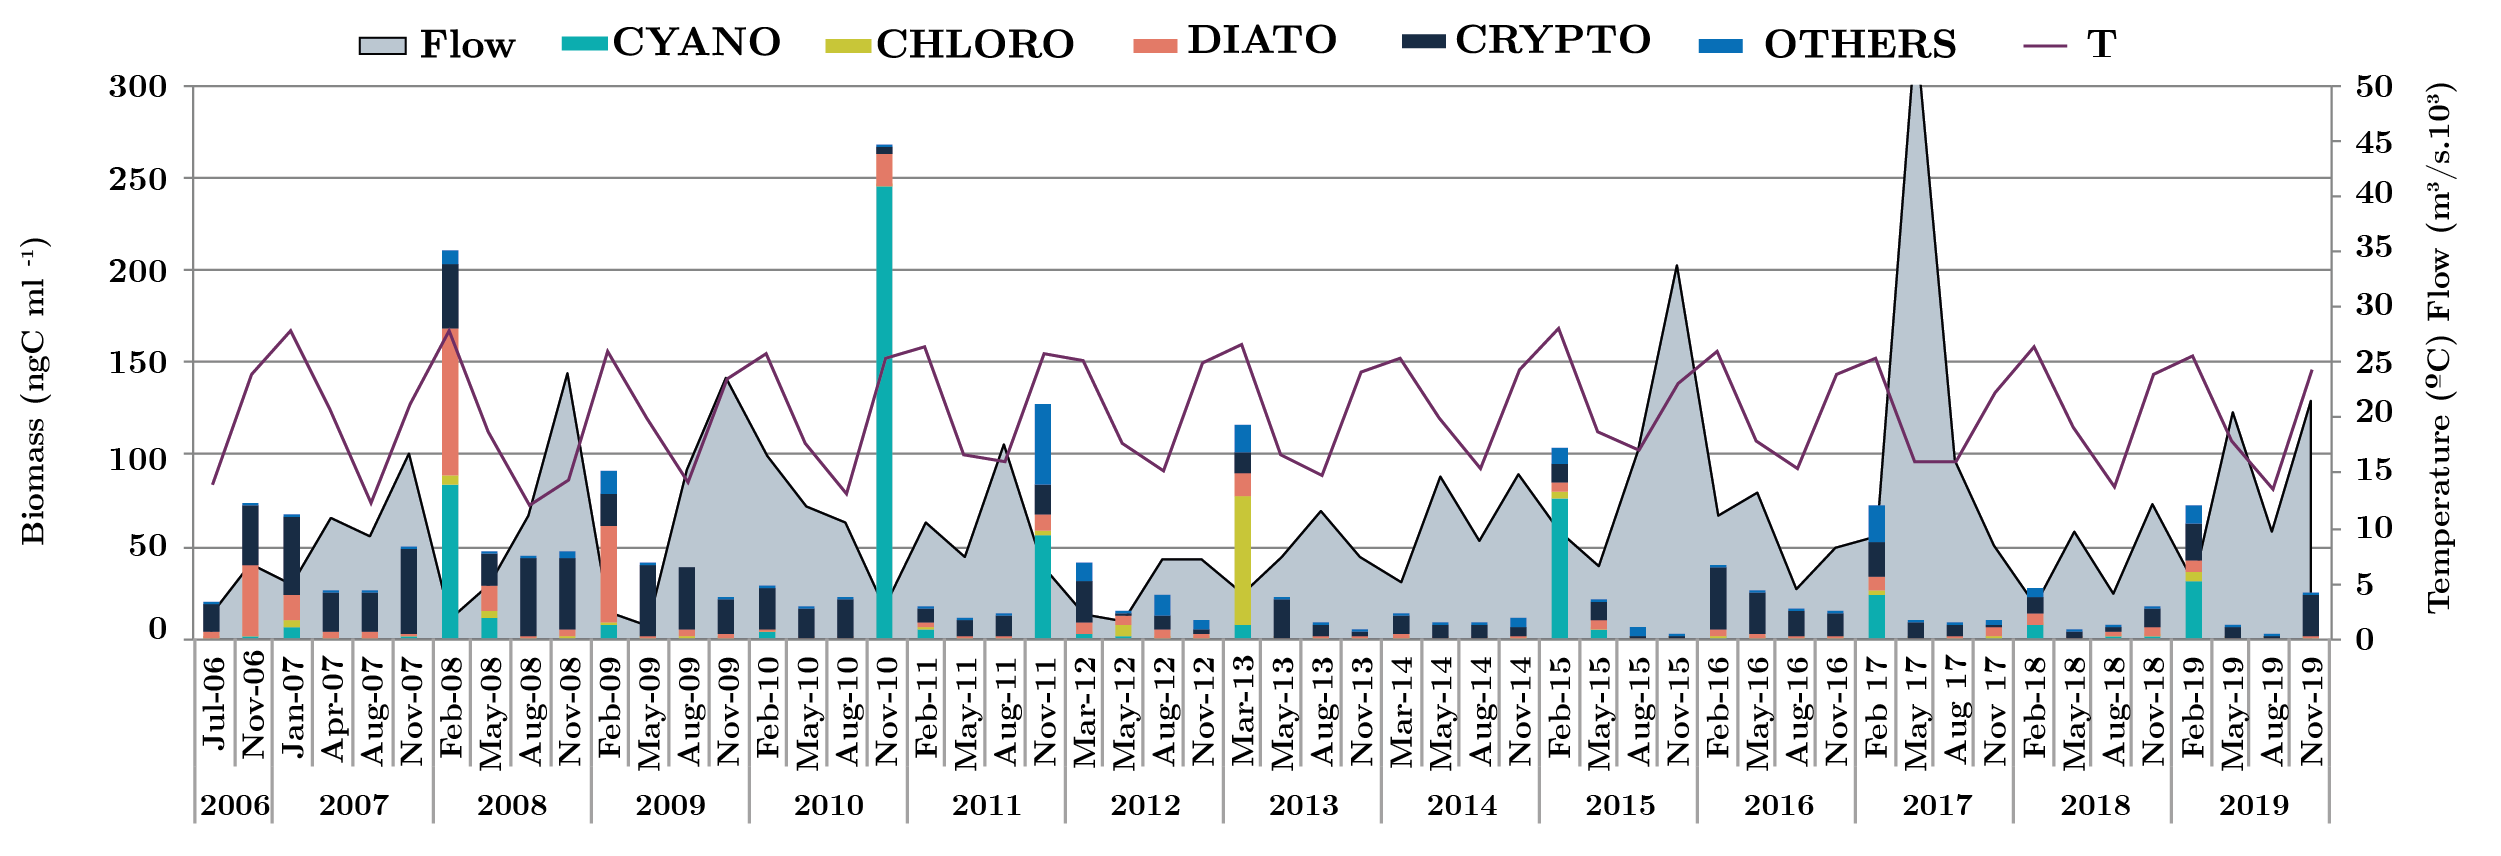
Figura 6. Monthly flow average for the three zones and the three sites (m3 s-1) (grey area), phytoplankton biomass groups (ngC ml-1) (bars) and temperature (solid black line), from 2006 to 2019. CYANO: cyanobacteria (green bar), CHLORO: Chlorophyta (dark green bar) DIATO: Bacillariophyta (red bar) CRYPTO: Crytophyta (black bar) and OTHERS: Chrysophyta, Dinophyta, Euglenophyta, Raphidophyta, Xanthophyta: Blue bar)
Discussion
After fourteen years of monitoring in the lower Uruguay River, phytoplankton biomass showed a seasonal pattern in which the flow, transparency and temperature were the structuring factors of the phytoplankton community. Potamoplankton is subjected to unidirectional transport, and it is affected by the physical, hydrological and geographical characteristics of the watershed. In the lower Uruguay River, like in any other lotic ecosystem (Giblin, et al., 2010, Zalocar De Domitrovic, et al., 2007, Sabater, et al., 2008), turbulence, associated with flow, has a direct effect on transparency, attenuating the penetration of light. In general, when flow increases, not only do turbulence and suspended solids increase due to erosion, but so do phosphorus and nitrogen levels. In high discharge conditions, the basin bottom is stirred, and resuspended sediments decrease transparency and increase the light extinction coefficient, resulting in decreasing values of phytoplankton biomass (Kirk, 1994). Paraná River, a similar regional river, showed the same behavior with regards to biogeochemichal processes and phytoplankton ecology (Bonetto, et al., 1983, O’Farrell, et al., 1996, Zalocar de Domitrovic, et al., 2007, Colombo, et al., 2015, De Cabo, et al., 2003). High densities of phytoplankton at the lower Paraná River during low flow were also recorded, similar to our results for the Uruguay River and to Ferrari and others (2011), O’Farrell and Izaguirre (2014) and Haakonsson and others (2017), have shown that water temperature and rainfall regime may play a key role in the proliferation of cyanobacteria, with precipitation providing indirect meteorological data of the river’s hydrological condition.
Temperature defines the typical seasonal patterns of rivers in the region (O’Farrell and Izaguirre, 2014); Zalocar de Domitrovic, et al., 2007, Soares, et al., 2007). Seasonal changes in phytoplankton community are related to seasonal changes in temperature, as it happens in other regions (Salmaso, N. and Braioni, 2008, Desortová, B. and Punčochář, 2011). This pattern of seasonal phytoplankton development is generally observed in temperate European rivers, such as in the middle stretch of the Elbe River in Germany, as well as in several rivers in England (Desortová, B. and Punčochář, 2011).
This is the first study that shows this seasonality with different phytoplankton community assemblages. Wehr and Descy (1998) believed that the most successful algal groups in large rivers were Bacillariophyta and Chlorophyta. Prevalence of diatoms and coccal green algae in phytoplankton composition is common for the large temperate rivers in Europe (Desortová, B. and Punčochář, 2011, Sabater et al., 2009, Reynolds and Descy 1996). Dokulil (2014) states that the phytoplankton species composition has always been dominated by diatoms, particularly centric taxa in the Danube River and others, like the Loire River (Descy, et al., 2012) and the lower Ebro River (Pérez, et al., 2009). Montesanto and others (2000), recorded a total of 122 phytoplankton taxa in the lower branches of the Aliakmon river (Greece), where the diatoms were one of the two more important groups. Garnier and others (1995) also reported similar patterns in the River Seine that contained a mixed group comprised of approximately 200 taxa, of which 90 were diatoms and 60 were Chlorophyceae, similar to findings for regional studies in the Paraguay-Paraná Rivers (Zalocar De Domitrovic, 2005), Negro River (Pérez, 2002), and Salado River (O’Farrell, 1993). However, in the Uruguay River, cryptophytes, cyanobacteria and diatoms were the most representative groups, followed by chlorophytes, dinoflagellates and euglenoids. Descy and others (2012) have proved that the presence of a few dominant species accompanied by a large number of sporadic species is the main feature of phytoplankton community structures in large river ecosystems, and similar results have also been reported in many European rivers. The different phytoplankton studies conducted in the Uruguay River have coincided in showing a relatively high species richness (around 200–400 taxa). The phytoplankton community composition and species richness (422 taxa) turned out to be lower than in previous studies in this region of the river, such as during 1986-1987, when 730 taxa were observed (O’Farrell, 1994). This could be due to the fact that most sampling points were on tributaries, not on the Uruguay River itself. The species richness was similar to other regulated rivers in the region, such as the Negro River, with 218 taxa (Pérez, 2002), the Salado River with 291 taxa (O’Farrell, 1993), the Paraná River (García de Emiliani, 1990) and to other tributaries of the Paraná River (García de Emiliani and de Manavella, 1981).
Nanoflagellates, Cryptomonas spp. and Aulacoseira spp. were the most frequent genus throughout the whole period, since they are organisms well adapted to systems with high suspended material content. This was also described by O’Farrell and Izaguirre, (2014), for the potamoplankton of the Uruguay River. Cryptomonas are capable of moving through the water column and respond well to conditions of high nutrient content. They can also convert to mixotrophic nutrition during light-limiting conditions. These organisms are very palatable for zooplankton, and their high density makes the system very rich for the next trophic level (Klaveness, 1988).
Total phosphorus concentration in Uruguay’s aquatic systems has been shown to be the most critical variable for water quality. The Uruguay River is not a limited nutrient system—it has appeared as mesotrophic with some peaks in total phosphorus, above the current limit set at 25 µg/l, leaning towards eutrophic. Consequently, nutrients would not be a limiting factor for phytoplankton development. According to previous studies upstream, in the Salto Grande reservoir, the main access route of nutrients into the system is also the flow of the Uruguay River (Berón, 1990; Conde, et al., 1996; Chalar, et al., 2017; EcoMetrix, 2006). The lower stretches of the river are a natural receptor for nutrient discharge.
This study showed the presence of 49 Cyanobacteria taxa. Different species of the genera Dolichospermum and Microcystis were dominant among the bloom-forming species, in agreement with what was reported at the Argentinean banks (O’Farrell, et al., 2014). A new species of Dolichospermum was also described: Dolichospermum uruguayense , referring to the Uruguay River (Kozlíková-Zapomèlová, et al., 2016). Cyanobacterial blooms commonly occur during summer in the lower Uruguay River and they have been reported since 1974 (Quirós and Luchini, 1982; Di Persia, et al., 1986; Berón, 1990; Conde, et al., 1996; Chalar, et al., 2017). M. aeruginosa had already been reported in this study area, reaching high concentrations from September 2006 to November 2008 (O’Farrell and Izaguirre, 2014) and its toxin, microcystin, was detected in the Uruguay River on several occasions (Vidal y Britos, 2012; UNESCO, 2009; Bonilla, et al., 2015; Kruk, et al., 2015). Those blooms, together with the Río Negro dam blooms, could be an important source of the Río de la Plata estuary cyanobacterial blooms, affecting the balneability of the coastal zone and its beaches (Sienra and Ferrari, 2006; Kruk, et al., 2019).
This work showed a small upward tendency in the IET index over fourteen years. This implies a tendency towards increasing eutrophication and, consequently, more cyanobacterial blooms could be expected in the River. This work also shows that flow and temperature are the main factors that regulate cyanobacterial blooms in the Uruguay River: under low flow conditions, the cyanobacteria remain in the Uruguay River, whereas when flow increases during the summer months, they reach the Río de la Plata estuary, impacting its beaches. According to Haakonsson and others (2017), Raphidiopsis and other Nostocales are spreading out their distribution as competitive genera among bloom-forming cyanobacteria in freshwater ecosystems. In a future scenario, complicated by global warming, with predicted increases in temperature and rainfall, this saxitoxin-producing species could have a much higher biomass.
Annexes
Annex 1. Species composition showing the current name and occurrence frequency of phytoplankton for each season during 2006-2019. Numbers reflect the frequency of occurrence in each season through the years.

Annex 2. Canonical correspondence analysis (CCA), principal axes and abiotic variables contribution made to the main species biomass matrix.
Acknowledgments
The authors would like to thank Profs. Jiří Komárek, Nora Maidana and Augusto Comas for their valuable comments and discussions about taxonomic issues. I am grateful to M. Dabezies, A. Krôger, L. Boccardi, G. Useta, Macarena Silva, Joe Reboledo, Marcelo Bado, J. Clemente and technicians of LATU-Fray Bentos and Montevideo for their assistance with samplings. To José and his “Coraje” vessel who are always ready to set sail. To Carlos Saizar, Elina Ordoqui and UPM pulp mill for their support. A special thanks to Maricarmen Pérez, who analyzed part of the phytoplankton samples, for her input and invaluable help with taxonomy, and for her friendship during this long and arduous monitoring study. I am very grateful to the anonymous reviewers for their comments, which helped me improve the original version of the manuscript.